What Is Return on Equity (ROE) and How Is It Calculated?
Master the return on equity calculation. Learn how Warren Buffett uses ROE to find elite businesses, how to perform a DuPont Analysis, and how to improve your returns.
BT
Bizcalc Team
·May 15, 2026
When legendary investor Warren Buffett is evaluating whether to acquire a new company or walk away, he does not obsess over total revenue. He does not get blinded by the sheer size of a company's market cap or its physical footprint.
Instead, he looks for businesses that act like relentless compounding machines. He looks for companies that take a single dollar of investor money and consistently turn it into a dollar and twenty cents, year after year, regardless of the economic climate.
To find these rare corporate machines, Buffett and virtually every elite financial analyst in the world rely heavily on one specific metric: Return on Equity (ROE).
If you are a business owner, understanding the return on equity calculation is the key to proving that your management team is actually creating wealth. If you are an investor, ROE is the ultimate filter to separate the mediocre businesses from the truly exceptional ones.
In this comprehensive guide, we will break down exactly how ROE works, walk through real-world calculation examples, introduce the advanced "DuPont Analysis," and explain how a seemingly perfect ROE can actually be a terrifying warning sign of impending bankruptcy.
Table of Contents
1. What Is Return on Equity (ROE)?
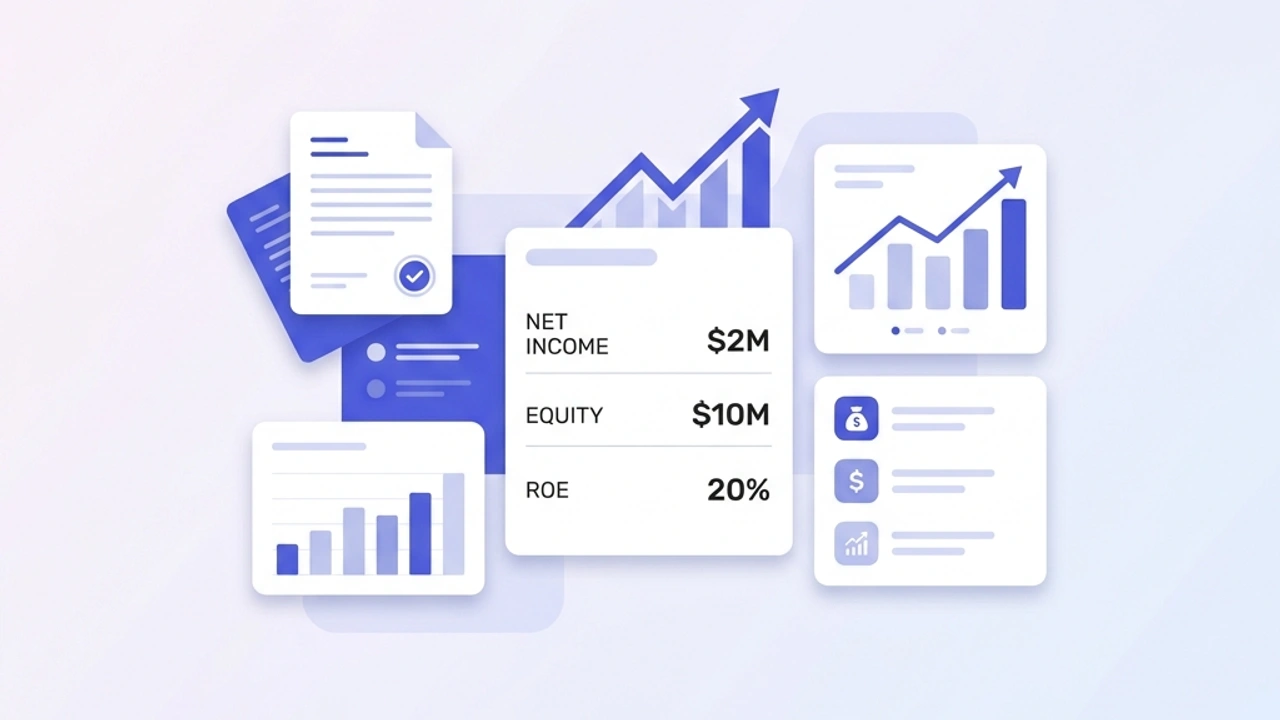
Return on Equity is a profitability metric that measures exactly how much net income a company generates using the money invested by its shareholders.
Think of ROE as a measure of management efficiency. If you give a CEO one million dollars of your own hard-earned cash, what are they going to do with it? Are they going to generate $50,000 in profit (a 5% return) or are they going to generate $300,000 in profit (a 30% return)?
The higher the ROE, the better the management team is at deploying capital. A company with a consistently high ROE requires very little external capital to grow because it generates so much internal cash that it can self-fund its own aggressive expansion.
📈
Return on Equity (ROE) Calculator
Skip the manual math. Plug in your net income and shareholders' equity to instantly calculate your ROE and benchmark it against industry averages.
2. The Formula: The Return on Equity Calculation Explained
The mathematical formula for ROE is elegant and simple. It requires only two numbers, which you can easily pull from a company's standard financial statements.
The Standard ROE Formula:ROE = Net Income / Average Shareholders' Equity
To ensure your calculation is completely accurate, you must understand exactly where these numbers come from and what they represent.
Understanding the Numerator: Net Income
Net Income (often referred to as the "bottom line") is the total amount of profit a company has generated over a specific period, usually a full fiscal year.
You will find this number at the very bottom of the company's Income Statement. It is calculated by taking total revenue and subtracting every single expense the company incurred, including the cost of goods sold (COGS), operating expenses, interest payments on debt, and all government taxes. It is the purest measure of what the company actually put in its pocket.
Understanding the Denominator: Shareholders' Equity
Shareholders' Equity represents the true net worth of the company. It is the amount of money that would theoretically be returned to the owners if the company liquidated all of its assets and paid off every single one of its debts.
You will find this number on the company's Balance Sheet. The basic accounting equation for equity is:
Total Assets - Total Liabilities = Shareholders' Equity
Important Accounting Note: Because Net Income is generated over the course of an entire 12-month year, but Shareholders' Equity is a "snapshot" taken on a single specific day, strict financial analysts prefer to use Average Shareholders' Equity. To find this, you add the equity from the very beginning of the year to the equity at the very end of the year, and divide by two.
3. A Step-by-Step Calculation Example
Let's apply the return on equity calculation to a real-world scenario by comparing two completely different businesses: Apex Software and Titan Manufacturing.
Both companies managed to generate exactly $2,000,000 in Net Income this year. On the surface, they look like equally successful businesses. Let's look deeper.
Analyzing Apex Software
Apex is a rapidly growing SaaS (Software as a Service) company. Because they only need laptops and cloud servers to operate, they require very little physical capital.
Net Income for the year: $2,000,000
Shareholders' Equity: $5,000,000
The Calculation:
$2,000,000 / $5,000,000 = 0.40 (or 40% ROE)
For every dollar the shareholders have invested in Apex Software, the company generated 40 cents of pure profit. This is an elite, world-class return on equity. The management team is a highly efficient capital allocator.
Analyzing Titan Manufacturing
Titan builds heavy industrial farming equipment. They require massive factories, thousands of steel suppliers, and expensive heavy machinery just to keep the lights on.
Net Income for the year: $2,000,000
Shareholders' Equity: $40,000,000
The Calculation:
$2,000,000 / $40,000,000 = 0.05 (or 5% ROE)
Even though Titan made the exact same $2,000,000 profit as Apex, their ROE is an abysmal 5%. They had to tie up $40 million of shareholder wealth just to generate that return. An investor looking at Titan would likely walk away, realizing they could get a completely risk-free 5% return by simply buying US Treasury bonds without taking on the terrifying risk of running a heavy manufacturing plant.
4. What Is a "Good" Return on Equity?
Once you have calculated your number, the immediate question is always, "Is this good enough?"
As a general, cross-market rule of thumb, an ROE between 15% and 20% is considered highly attractive. Anything consistently above 20% indicates that the company possesses a massive economic moat or a unique competitive advantage.
However, judging ROE in a vacuum is dangerous. You must benchmark the company against its direct competitors within the same industry.
Industry Averages
Technology and Software: Expect high ROEs (15% to 30%+). Because software can be infinitely replicated at practically zero marginal cost, these companies require very few assets to scale, keeping the equity denominator small and driving the ratio sky-high.
Utilities and Telecommunications: Expect lower ROEs (8% to 12%). A utility company must spend billions of dollars building physical power plants and laying miles of copper wire. This massive asset requirement bloats the equity base, dragging down the final percentage.
Banking and Financial Services: Banks typically aim for a 10% to 15% ROE. If a bank's ROE climbs significantly higher than 15%, it is often a warning sign that the bank is taking on incredibly dangerous, highly leveraged speculative bets to artificially boost its returns.
5. The Secret Weapon: The DuPont Analysis
The standard return on equity calculation is a fantastic starting point, but it lacks operational detail. If a company's ROE drops from 20% to 10% in a single year, the standard formula won't tell you why it happened. Was it a pricing issue? Did a factory break down? Did the company pay off a massive loan?
To solve this mystery, the DuPont Corporation created an advanced financial model in the 1920s that is still universally used today. The DuPont Analysis breaks the single ROE metric into three distinct operational levers.
⚖️
Debt-to-Equity Calculator
Always pair ROE with your debt levels. Calculate your Debt-to-Equity ratio to ensure a high ROE isn't hiding dangerous financial leverage.
Let's break down exactly what each of these three levers tells you about the business.
Lever 1: Net Profit Margin (Operating Efficiency)
Formula: Net Income / Total Revenue
This measures how effectively the company controls its costs. If a company sells a product for $100 and keeps $15 in profit, its margin is 15%. If the overall ROE is dropping because the profit margin is shrinking, it means the CEO is failing to control operating expenses, or competitors are forcing the company to lower its prices.
Lever 2: Asset Turnover (Asset Utilization)
Formula: Total Revenue / Average Total Assets
This measures how efficiently the company uses its physical assets to generate sales. If a retail company buys a $1 million storefront and only generates $500k in annual sales, their asset turnover is a terrible 0.5. If the overall ROE is dropping because asset turnover is shrinking, it means the company is hoarding too much dead inventory or leaving its expensive factories sitting idle.
Lever 3: Financial Leverage (The Debt Multiplier)
Formula: Average Total Assets / Average Shareholders' Equity
This is the most critical and dangerous lever. It measures how much debt the company is using to finance its assets. (We will cover the dark side of this lever in the next section).
By using the DuPont Analysis, a CEO can instantly pinpoint exactly which part of the business is broken. If ROE is low, they don't just throw their hands up in defeat; they look at the three levers and systematically fix their pricing (Margin), sell off unused factories (Asset Turnover), or adjust their bank loans (Leverage).
6. The Dark Side of ROE: When Debt Creates an Illusion
Return on Equity is easily the most manipulated metric in modern corporate finance. Because the formula is essentially Profit / Equity, a CEO can artificially skyrocket their ROE without actually making the company any more profitable.
How? By aggressively shrinking the denominator (Equity) using massive amounts of Debt.
Let's look at an extreme example.
Company A has $10 Million in Assets and zero debt. Its Equity is $10 Million. It makes $1 Million in profit.
Company A's ROE: $1M / $10M = 10%
Company B has $10 Million in Assets, but the CEO took out $9 Million in bank loans (Debt). Because Assets - Debt = Equity, Company B's Equity is only $1 Million. It also makes $1 Million in profit.
Company B's ROE: $1M / $1M = 100%
On paper, Company B has a breathtaking 100% ROE. They look like financial geniuses. But in reality, Company B is a ticking time bomb. They are dangerously over-leveraged. If a mild recession hits and revenue dips by just 10%, Company B will instantly default on its $9 million bank loan and go completely bankrupt.
The Golden Rule for Investors: Never look at ROE in isolation. You must always check the company's Debt-to-Equity ratio. If a company has a 40% ROE, but they also have massive, suffocating levels of debt, the high ROE is an illusion created by leverage, not by operational excellence.
7. Return on Equity vs. Return on Assets (ROA)
To combat the "debt illusion" mentioned above, smart financial analysts always pair ROE with a secondary metric: Return on Assets (ROA).
While ROE only measures the return against the shareholders' money, ROA measures the return against all the assets the company controls, regardless of whether those assets were bought with equity or bought with a bank loan.
The Formula:ROA = Net Income / Total Assets
If a company has a massive 35% ROE, but a terrible 2% ROA, the mystery is instantly solved: the company is using terrifying amounts of debt to run its operations.
By comparing the two metrics side-by-side, you get a complete, unmanipulated view of exactly how effectively the management team is running the business.
8. How to Improve a Bad Return on Equity
If you are a business owner and your ROE is lagging behind your industry peers, you must take immediate strategic action. Based on the DuPont Analysis, you have three primary ways to force your ROE higher.
Strategy 1: Increase Your Profit Margins
Stop competing on price. If you are constantly offering discounts to win clients, you are destroying your bottom line. Raise your prices by 10%. While you might lose a few budget-conscious customers, the revenue from your premium clients will drop straight to your Net Income, instantly boosting your ROE. Furthermore, audit your operating expenses. Fire underperforming staff, negotiate cheaper raw materials from your suppliers, and cancel unused software subscriptions.
Strategy 2: Optimize Your Asset Turnover
Cash tied up in a warehouse is dead money. You must aggressively manage your inventory. If you have products that haven't sold in six months, liquidate them at cost. It is better to have cash in the bank than dusty boxes on a shelf. Additionally, if you own expensive equipment that you only use once a month, sell it and rent it instead. By shrinking your total asset base while maintaining the same revenue, your efficiency skyrockets.
Strategy 3: Execute a Strategic Share Buyback
If your company is generating massive amounts of cash, but your stock price is stagnant, the best way to improve ROE is to buy back your own shares. When a company repurchases its own stock, it permanently removes that equity from the balance sheet. Because the denominator (Equity) shrinks, the remaining shareholders instantly see their ROE percentage increase, making the company vastly more attractive to future investors.
Final Thoughts on Capital Efficiency
Calculating Return on Equity is the ultimate litmus test for a management team. It strips away the vanity metrics of gross revenue and total headcount, and forces a company to answer the only question that truly matters to an investor: "How effectively are you compounding my money?"
If your ROE is consistently high and your debt levels are low, you have built an incredibly rare, self-sustaining economic engine. If your ROE is low, you are destroying shareholder wealth, and you must rapidly overhaul your pricing, your asset management, or your capital structure before your investors take their money elsewhere.
📊
Visualize Your Management Performance
Ready to see how efficiently your business is running? Plug your balance sheet numbers into our free ROE calculator and get an instant verdict on your capital efficiency.
Return on Equity (ROE) is a financial ratio that measures a company's profitability in relation to the equity (or money) invested by its shareholders.
How do you calculate ROE?
Divide the company's Net Income by its Average Shareholders' Equity. The result is expressed as a percentage. Formula: (Net Income / Shareholders' Equity) * 100.
What is considered a good ROE?
A 'good' ROE is highly dependent on the industry average. However, many investors consider an ROE between 15% and 20% to be strong and indicative of efficient management.
Can a high ROE be a bad sign?
Yes. If a company takes on massive amounts of debt to buy back its own stock, shareholders' equity shrinks. This artificially inflates ROE, but greatly increases the financial risk of the company.
What is the DuPont Analysis of ROE?
The DuPont analysis breaks ROE down into three components: profit margin, asset turnover, and financial leverage. This helps investors pinpoint exactly why ROE is going up or down.
#return on equity calculation#ROE formula#shareholders equity#dupont analysis#financial leverage#profitability ratios