What Is Inventory Turnover Ratio and Why Does It Matter?
Master your inventory turnover ratio calculation. Learn the formulas for COGS, average inventory, and Days Sales of Inventory (DSI), plus industry benchmarks for a healthy business.
BT
Bizcalc Team
·May 14, 2026
For any business that sells physical products—whether you are a massive global manufacturer, a thriving e-commerce brand, or a local hardware store—your inventory is your single largest asset. It is quite literally your cash, temporarily frozen in the form of boxes sitting on warehouse shelves.
The faster you can thaw that cash by selling the boxes, the faster your business can grow. The slower that inventory moves, the closer your business creeps toward a lethal cash flow crisis.
But how do you mathematically measure the speed at which you sell your products?
You do it by mastering your inventory turnover ratio calculation.
This single metric is the ultimate pulse check for product-based businesses. It tells you if you are over-ordering, under-marketing, or pricing your items incorrectly. In this comprehensive, 2,000+ word guide, we will break down the exact formulas you need to calculate your turnover ratio, how to determine your Days Sales of Inventory (DSI), industry benchmarks to measure your success against, and actionable strategies to optimize your supply chain.
📦
Inventory Turnover Calculator
Instantly calculate your inventory turnover ratio and Days Sales of Inventory (DSI) from your COGS and average inventory figures — no spreadsheet needed.
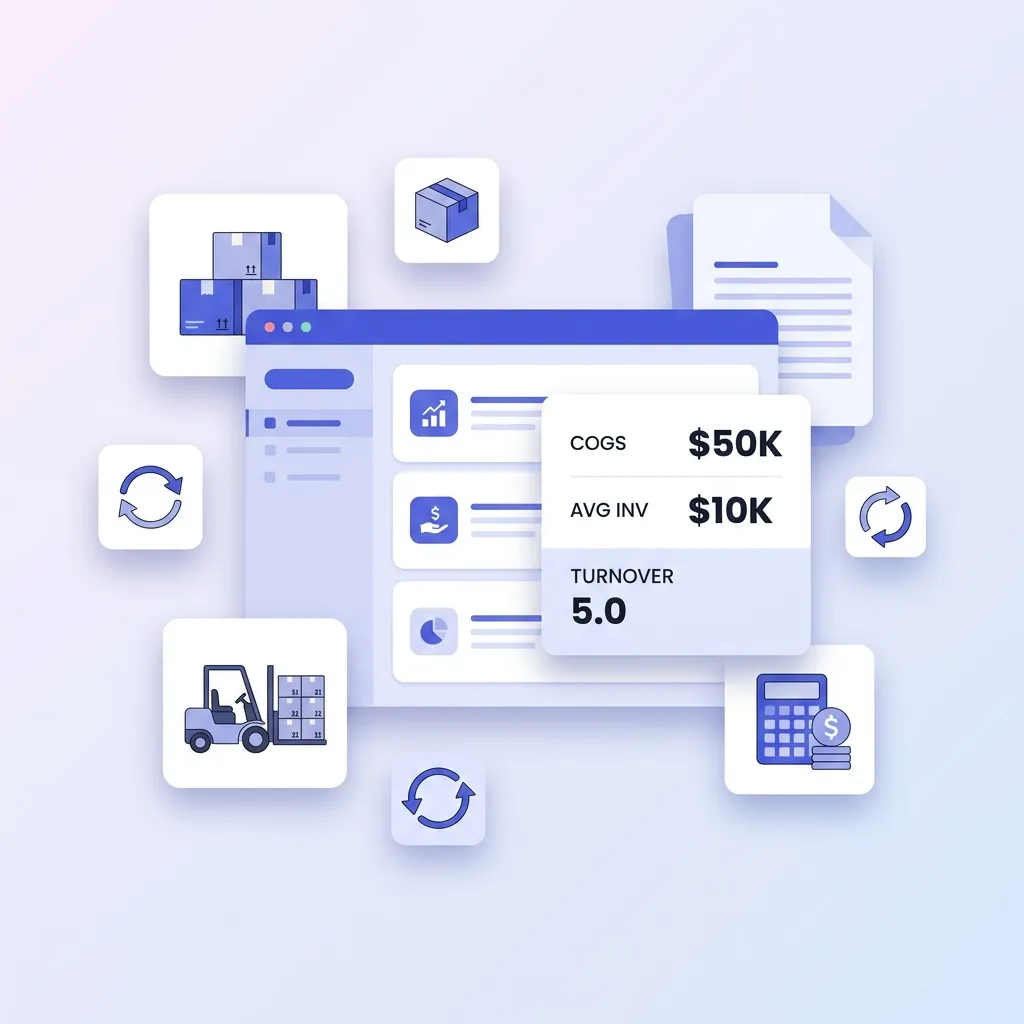
The inventory turnover ratio is a financial metric that measures how many times a company has sold and completely replaced its entire stock of inventory over a specific period of time (usually one year).
If your turnover ratio is 1.0, it means it took you an entire year to sell through your warehouse one time.
If your turnover ratio is 12.0, it means you completely cleared out and restocked your warehouse 12 times in a single year (or roughly once a month).
Generally speaking, a higher turnover ratio is better because it indicates strong sales and efficient purchasing. A low turnover ratio implies weak sales, poor purchasing decisions, and excess "dead" stock gathering dust and eating up your capital.
(Want to skip the manual math? Use our Inventory Turnover Calculator to instantly generate your turnover ratio and DSI).
The Formula: Inventory Turnover Ratio Calculation
To accurately calculate your inventory turnover, you need to pull two numbers from your company's income statement and balance sheet: Cost of Goods Sold (COGS) and Average Inventory.
The Formula:Inventory Turnover Ratio = Cost of Goods Sold (COGS) / Average Inventory
Step 1: Determine Your Cost of Goods Sold (COGS)
You cannot use your total sales revenue for this calculation. If you use revenue, your turnover ratio will be artificially inflated by your profit margins. You must use the actual cost of the items you sold.
COGS includes the direct costs required to produce or acquire your goods: wholesale prices, manufacturing labor, and inbound freight. It does not include operating expenses like rent or marketing.
Step 2: Calculate Your Average Inventory
You cannot simply look at the value of the inventory sitting in your warehouse today. Inventory levels fluctuate wildly throughout the year due to seasonality (e.g., massive stock spikes right before the winter holidays). To get an accurate reading, you must average out your stock levels.
The Average Inventory Formula:(Beginning Inventory + Ending Inventory) / 2 = Average Inventory
Beginning Inventory: The value of the inventory you held on the very first day of the year (or quarter).
Ending Inventory: The value of the inventory you held on the very last day of the year.
A Complete Worked Example
Let's look at how this math works in the real world for a mid-sized consumer electronics retailer over the course of a fiscal year.
The Retailer's Financial Data:
Value of inventory on Jan 1 (Beginning Inventory): $150,000
Value of inventory on Dec 31 (Ending Inventory): $250,000
Total Cost of Goods Sold (COGS) for the year: $1,200,000
The electronics retailer has an inventory turnover ratio of 6.0. This means they sold through their entire inventory stock 6 times over the course of the year, or roughly once every two months.
Translating the Ratio into Time: Days Sales of Inventory (DSI)
While a ratio of "6.0" is useful for financial analysts, it is often difficult for warehouse managers and purchasing agents to conceptualize. It is much more practical to convert that ratio into a measure of time.
This metric is known as Days Sales of Inventory (DSI) or "Days in Inventory." DSI tells you exactly how many days, on average, a product sits in your warehouse before it is finally sold.
The DSI Formula:(365 Days / Inventory Turnover Ratio) = Days Sales of Inventory
Using our electronics retailer example from above:
365 / 6.0 = 60.8 Days
This means that from the moment a box of electronics arrives at the loading dock, it takes an average of 61 days for a customer to buy it.
Just like profit margins, there is no universal "perfect" turnover ratio. It depends entirely on the industry you operate in and the nature of the products you sell.
1. High Volume, Low Margin (The Grocery Model)
Grocery stores, supermarkets, and convenience stores deal in perishable goods (milk, bread, produce) with razor-thin profit margins. They must turn their inventory incredibly fast to survive and avoid spoilage.
Typical Turnover Ratio: 12.0 to 20.0+ (DSI of 18 to 30 days).
2. Standard Consumer Retail (Apparel & Electronics)
Clothing stores and electronics retailers sit in the middle of the spectrum. They need to turn their inventory quickly before styles change or technology becomes obsolete, but they don't face the immediate threat of food spoilage.
Typical Turnover Ratio: 4.0 to 8.0 (DSI of 45 to 90 days).
3. High Margin, Low Volume (Luxury Goods & Machinery)
Luxury car dealerships, high-end jewelry boutiques, and industrial manufacturing companies sell expensive products with massive profit margins. Because the items are so expensive, it is completely normal for them to sit on a showroom floor for months at a time before a qualified buyer is found.
Typical Turnover Ratio: 1.0 to 3.0 (DSI of 120 to 365 days).
The Dangers of a Low Turnover Ratio
If you run your inventory turnover ratio calculation and discover your ratio is a 1.5 (when your industry average is a 5.0), your business is in severe danger. A low ratio points to several toxic business conditions:
1. The Trap of "Dead Stock"
If your turnover is low, it means your warehouse is filling up with products that nobody wants to buy. Eventually, this inventory becomes obsolete. If you sell fashion apparel and winter coats are still sitting in your warehouse in June, that is dead stock. You will eventually be forced to sell it at a massive loss or throw it in a landfill.
2. Excessive Holding Costs
Warehouses are not free. A low turnover ratio means you are paying exorbitant fees for rent, electricity, security, and insurance simply to guard products that aren't making you any money.
3. Crushing Cash Flow Constraints
If your cash is tied up in slow-moving inventory, you cannot use that cash to run marketing campaigns, hire new employees, or develop new products. You are asset-rich but cash-poor, which is a leading cause of small business bankruptcy.
The Hidden Danger of an Extremely High Turnover Ratio
If a low ratio is bad, you might assume that the highest possible ratio is the goal. However, if your turnover ratio is significantly higher than your industry average, it can actually be a sign of a broken supply chain.
1. Devastating Stockouts
If your turnover ratio is too high, it usually means you are not carrying enough inventory to meet consumer demand. When a customer tries to buy from you, you are constantly "Sold Out." The customer will immediately go to your competitor, resulting in massive losses in potential revenue and brand loyalty.
2. High Shipping and Purchasing Costs
If you are constantly running out of inventory, your purchasing team will be forced to place small, panicked orders to restock quickly. This prevents you from securing large volume discounts from your manufacturer, and it forces you to pay for expensive expedited air-freight instead of cheap, slow ocean shipping.
4 Strategies to Improve Your Inventory Turnover
If your turnover ratio is unhealthy, you must take immediate action to optimize your supply chain and marketing efforts.
Strategy
How to Implement It
Ruthless Forecasting
Stop buying inventory based on "gut feeling." Use historical sales data, seasonal trends, and predictive software to order exactly what you need, when you need it.
Liquidate Slow Movers
Identify the bottom 10% of your products that are dragging down your average. Run massive clearance sales, bundle them with fast-moving items, or donate them for a tax write-off. Get the dead stock out of your warehouse.
Implement Just-in-Time (JIT) Purchasing
If your suppliers are reliable, shift to a JIT model where you order smaller quantities of inventory more frequently, drastically reducing the amount of cash you have tied up on warehouse shelves.
Increase Marketing Spend
Sometimes the inventory purchasing isn't the problem; the marketing is. If you have great products that aren't moving, temporarily lower your profit margins by running aggressive ad campaigns to clear the shelves and generate cash flow.
Final Thoughts on Inventory Management
Calculating your inventory turnover ratio is not a vanity metric to check once a year during tax season. It is a critical, operational vital sign that should dictate your purchasing, pricing, and marketing strategies on a monthly basis.
A healthy turnover ratio proves that your business is a well-oiled machine: you are buying the right products, in the right quantities, and selling them at the right pace. Make the inventory turnover ratio calculation a standard part of your end-of-month financial review to ensure your cash flow remains positive and your warehouse remains highly profitable.
📦
Inventory Turnover Calculator
Run your monthly inventory check in seconds. Input your COGS and inventory figures to get your turnover ratio and DSI instantly.
The inventory turnover ratio measures how many times a business has sold and replaced its entire stock of inventory over a specific period, usually a year.
How do you calculate inventory turnover?
Divide the Cost of Goods Sold (COGS) by the Average Inventory value for the same period. Formula: COGS / ((Beginning Inventory + Ending Inventory) / 2).
What is considered a good inventory turnover ratio?
A 'good' ratio depends heavily on the industry. Supermarkets might have a ratio of 15 (fast turnover), while luxury car dealerships might have a ratio of 2 or 3.
What does a low inventory turnover ratio mean?
A low ratio indicates weak sales, excess inventory, or obsolete stock. It means cash is tied up in unsold products, increasing storage costs and the risk of obsolescence.
How can a business improve its inventory turnover?
Businesses can improve turnover by running promotions to clear out old stock, adjusting purchasing to better match demand, and using Just-in-Time (JIT) inventory management.
#inventory turnover ratio calculation#days sales of inventory#average inventory#COGS#retail metrics#stockouts