The payback period calculation explained step by step. Learn how to measure how long it takes to recover an investment, compare projects, and make smarter capital decisions.
BT
Bizcalc Team
·May 24, 2026
Every business decision that involves spending a significant amount of money boils down to one fundamental question: "How long before I get my money back?"
Whether you are buying a new piece of factory equipment, launching a marketing campaign, acquiring a competitor, installing solar panels on your warehouse roof, or upgrading your entire IT infrastructure — the single most important piece of information you need before committing capital is your recovery timeline.
This is exactly what the Payback Period measures. It is one of the oldest, simplest, and most universally used capital budgeting tools in corporate finance. From a small family business evaluating whether to buy a new delivery van, to a multinational corporation deciding whether to build a new manufacturing plant in Southeast Asia, the payback period calculation is always the first question asked in the boardroom.
In this comprehensive guide, you will find the payback period calculation explained in full. We will break down both the simple and advanced formulas, walk through detailed real-world examples, reveal the critical limitations you must understand before relying on it, and show you how to combine it with complementary metrics to make truly bulletproof investment decisions.
Table of Contents
1. What Is the Payback Period?
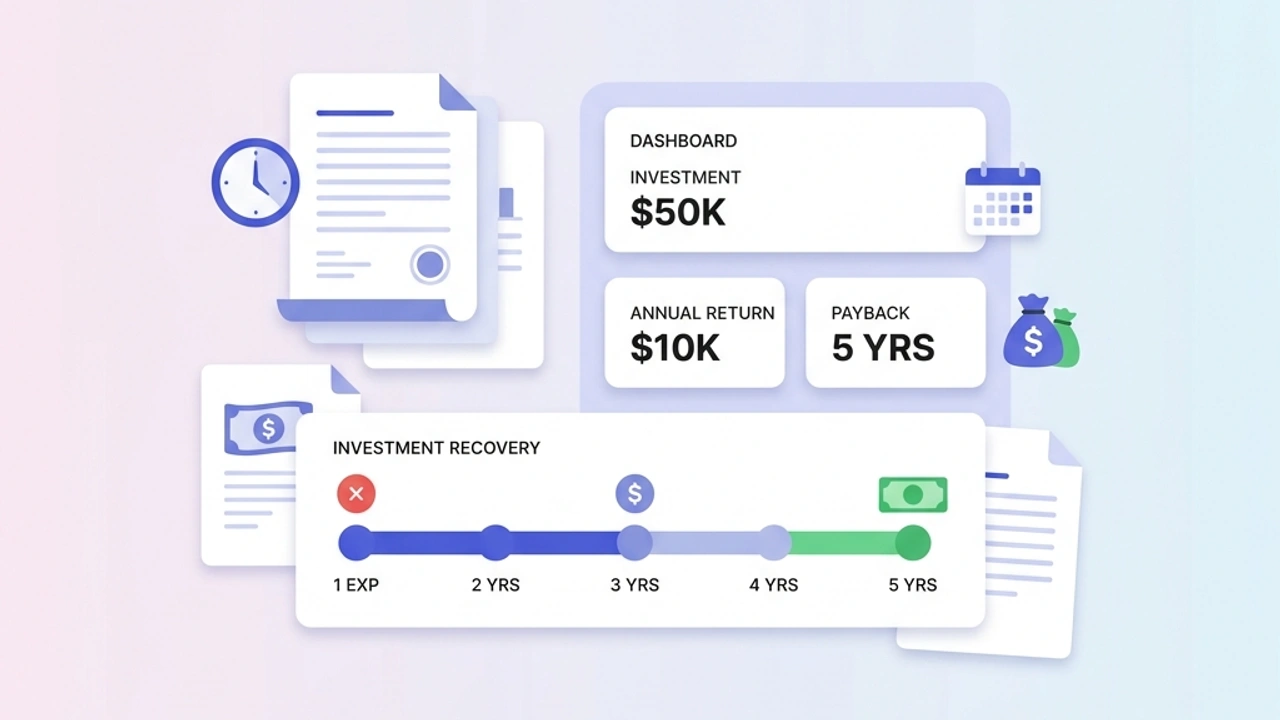
The payback period is the length of time it takes for an investment to generate enough cumulative cash inflows to fully recover its original upfront cost. In short, it answers the question: "If I spend X today, when will my returns cover that X entirely?"
It is, at its core, a measurement of risk. The longer the payback period, the more time your capital is exposed to market volatility, competitive disruption, and economic uncertainty. A project with a 2-year payback period is far less risky than a project with an 8-year payback period, simply because less time needs to pass for your initial investment to be safe.
Unlike more complex financial metrics, the payback period speaks in a language that every stakeholder understands immediately — time. You do not need to explain discount rates, net present values, or weighted average costs of capital to a board of directors. You simply say: "This investment pays for itself in 3 years and 4 months," and everyone in the room instantly grasps the risk profile.
*(Note: You can bypass all the manual arithmetic by running your numbers instantly through our free Payback Period Calculator).*
⏱️
Payback Period Calculator
Enter your initial investment and projected cash inflows to instantly calculate your exact payback period — in years, months, and days. No spreadsheet required.
For investments that generate consistent, predictable cash inflows each period, the calculation is delightfully straightforward.
The Formula:Payback Period = Initial Investment Cost / Annual Net Cash Inflow
The result gives you the number of years (or fractions of a year) it takes to recoup the investment.
Step-by-Step Example: A New Coffee Roasting Machine
Let's say a specialty coffee roaster is considering purchasing a new automated roasting machine. Here are the relevant numbers:
Initial Investment (machine cost): $60,000
Annual Revenue generated by the machine: $25,000
Annual Operating Cost of the machine (electricity, maintenance): $5,000
Annual Net Cash Inflow: $25,000 − $5,000 = $20,000
Applying the Formula:
Payback Period = $60,000 / $20,000
Payback Period = 3 years
After exactly 3 years of operation, the machine will have generated enough cumulative profit to cover its original $60,000 purchase price. Every dollar it generates from Year 4 onward is pure net profit.
3. Uneven Cash Flows: The Cumulative Method
The simple formula above only works cleanly when your annual cash inflows are identical every year. In the real world, this is rarely the case. A new product launch, for example, might generate modest revenue in Year 1, rapidly grow in Year 2, and plateau in Year 3 as the market matures.
When cash flows are uneven, you need to use the Cumulative Cash Flow Method, which tracks the running total of returns year by year until the balance turns positive.
Step-by-Step Example: A New Product Line Launch
A clothing manufacturer is launching a new premium athleisure range. The upfront cost of design, tooling, and initial inventory is $80,000. The projected cash flows over five years are:
Year
Annual Cash Inflow
Cumulative Cash Flow
1
$15,000
−$65,000
2
$22,000
−$43,000
3
$30,000
−$13,000
4
$35,000
+$22,000
5
$40,000
+$62,000
By the end of Year 3, the cumulative cash flow is still −$13,000. During Year 4, the product generates $35,000. This means the investment recovers the remaining $13,000 during Year 4.
To find the exact month within Year 4:
$13,000 (remaining) / $35,000 (Year 4 total) = 0.37 of a year
0.37 × 12 months = approximately 4.4 months
Payback Period = 3 years and approximately 4 months
This level of precision is important for comparing projects head-to-head — a difference of even a few months can determine which investment gets approved.
4. Discounted Payback Period: Accounting for the Time Value of Money
The simple payback period method has one major intellectual flaw that sophisticated financial analysts cannot ignore: it treats $1 earned in Year 6 as being exactly equal to $1 earned today. This is economically incorrect.
Due to inflation and the opportunity cost of capital (the returns you could be earning by investing that money elsewhere), future cash flows are inherently worth less than present cash flows. A dollar you receive six years from now is genuinely worth less than a dollar you have in your wallet today.
The Discounted Payback Period corrects for this by applying a discount rate to each year's cash flows before adding them to the cumulative total, using the concept of Net Present Value (NPV).
The Discount Factor Formula:Discounted Cash Flow = Actual Cash Flow / (1 + Discount Rate)^Year
Example: Comparing Simple vs. Discounted Payback
Let's use the same clothing manufacturer example, but now apply a 10% annual discount rate (representing their cost of capital):
Year
Actual Cash Flow
Discount Factor (10%)
Discounted CF
Cumulative Discounted CF
1
$15,000
0.909
$13,636
−$66,364
2
$22,000
0.826
$18,182
−$48,182
3
$30,000
0.751
$22,539
−$25,643
4
$35,000
0.683
$23,905
−$1,738
5
$40,000
0.621
$24,836
+$23,098
With simple payback, this investment recovers in ~3 years 4 months. But with the Discounted Payback Period, the investment doesn't fully recover until well into Year 5 — a significantly more conservative and realistic assessment of the risk.
If the company has a rule that all investments must pay back within 4 years, the simple method says "approve it" while the discounted method says "reject it." This distinction can make or break a business.
5. What Is a "Good" Payback Period?
Just like most financial metrics, there is no single universal "good" number. What counts as an acceptable payback period depends heavily on three factors:
1. Your Industry
Some industries naturally have longer payback cycles and plan accordingly. A pharmaceutical company spending $500 million to develop a new drug expects a 10–15 year payback horizon. A digital marketing agency spending $10,000 on new project management software expects a payback period of 3–6 months.
2. Your Company's Hurdle Rate
Most organizations establish a maximum acceptable payback period — known as their "hurdle rate." Any project that fails to pay back within this defined window is automatically rejected, regardless of its theoretical long-term profitability. Common hurdle thresholds by business size:
Business Size
Typical Maximum Payback Period
Early-stage startup
12–18 months
Growing SME
2–3 years
Established mid-size company
3–5 years
Large corporation / infrastructure
5–10 years
3. The Risk Environment
During periods of economic uncertainty, high inflation, or rising interest rates, businesses tighten their payback criteria dramatically. A project that was "acceptable" at 4 years during a boom period might be reclassified as "too risky" at 4 years during a downturn.
6. Payback Period in Practice: Evaluating Multiple Projects
📊
NPV Calculator
Once you have your payback period, run a full Net Present Value analysis to determine if the investment is truly creating wealth after accounting for the time value of money.
The payback period's greatest power comes when you need to rank and prioritize multiple competing investment opportunities with a limited capital budget.
Scenario: A Logistics Company Evaluating Three Investments
A logistics firm has $200,000 of available capital to invest. Their board has set a maximum payback period of 4 years. They have three proposals on the table:
Investment
Upfront Cost
Annual Return
Payback Period
Within Hurdle?
New delivery van (electric)
$45,000
$18,000
2.5 years
✅ Yes
Warehouse automation system
$120,000
$24,000
5 years
❌ No
Route optimization software
$35,000
$14,000
2.5 years
✅ Yes
The warehouse automation system, despite likely being the most transformative long-term investment, fails the 4-year hurdle and would be rejected based on payback criteria alone. The van and software are both approved, costing a combined $80,000 — well within the $200,000 budget.
Use our Payback Period Calculator to quickly run these comparisons across your own capital projects and instantly identify which investments meet your company's specific hurdle rate.
7. The Three Fatal Limitations You Must Know
The payback period is a powerful screening tool, but it is dangerously incomplete if used as your sole decision-making metric. Every experienced CFO and investment analyst knows these three critical weaknesses:
Limitation 1: It Completely Ignores Profitability After Payback
The payback period only cares about when you break even — it is entirely blind to what happens afterward.
Consider two projects, both costing $100,000:
Project Alpha: Pays back in 2 years, then generates $5,000/year for 10 more years (total profit: $50,000)
Project Beta: Pays back in 3 years, then generates $80,000/year for 10 more years (total profit: $800,000)
Based purely on payback period, you would choose Project Alpha. Based on actual wealth creation, Project Beta is 16 times more valuable. A business that uses only payback period as its investment filter will systematically choose the wrong projects.
Limitation 2: It Ignores the Time Value of Money (Simple Method)
As demonstrated with the Discounted Payback Period example above, treating future cash flows as equivalent to present cash flows leads to false confidence. A project that appears to pay back in 3 years on a simple basis might require 4.5 years on a discounted basis — the difference between "approved" and "rejected" under most corporate hurdle rules.
Limitation 3: It Provides No Guidance on Absolute Value
Two projects might both have a 3-year payback period, but one generates $1,000 per year and the other generates $1,000,000 per year. The payback period treats both identically. It is a risk-and-timing metric, not a wealth-creation metric.
8. Combining Payback Period with Complementary Metrics
Because of the limitations above, no serious financial analyst ever uses payback period in isolation. It should always be one instrument in a full suite of capital budgeting tools.
The Ideal Capital Budgeting Framework
Step 1 — Screen with Payback Period: Quickly eliminate any project that falls outside your maximum hurdle rate. This efficiently narrows a large list of proposals to a manageable shortlist.
Step 2 — Rank by NPV: For every project that passes the payback screen, calculate its Net Present Value. NPV accounts for the time value of money and measures the total wealth (in today's currency) the project will create over its entire lifetime. Projects with the highest positive NPV should be prioritized.
Step 3 — Confirm with ROI: Calculate the total Return on Investment over the project's full lifespan to ensure you are maximizing your capital efficiency.
Step 4 — Stress-Test with Sensitivity Analysis: Adjust your key assumptions (revenue drops 20%, costs rise 15%) and recalculate to see how robust the investment is against a pessimistic scenario.
This four-step framework separates amateur capital allocation from elite financial management.
9. Common Mistakes to Avoid
Even experienced business owners make these errors when calculating payback period:
Using revenue instead of net cash inflow: The formula requires net cash inflow (revenue minus all associated operating costs). Using gross revenue massively overstates your returns and produces an artificially optimistic payback estimate.
Forgetting hidden upfront costs: The "Initial Investment" should include every cost required to make the asset operational — purchase price, installation, staff training, and any initial maintenance contracts. Forgetting these will dramatically understate your true investment.
Ignoring working capital requirements: Some investments require you to carry additional inventory or float more cash in accounts receivable. These working capital needs consume cash in exactly the same way as a capital expenditure, but are frequently omitted from payback calculations.
Not adjusting for taxes: Depending on your jurisdiction, capital expenditures may be subject to different tax treatment (depreciation allowances, capital gains rules). Your net cash inflows should reflect post-tax figures, or your payback estimate will be meaninglessly optimistic.
Final Thoughts on Investment Recovery
The payback period calculation is not the most sophisticated financial tool in existence, but it earns its place in every capital budgeting process because of its clarity and speed. In a world where management teams are overwhelmed with data and competing priorities, the ability to instantly communicate "this pays for itself in 2.5 years" is genuinely powerful.
Use it as your first filter to quickly eliminate the weakest candidates. Then apply NPV analysis and full ROI modeling to make your final decision with complete financial confidence.
The best investment decisions in business combine the simplicity of the payback period with the depth of more comprehensive analysis — and the best business leaders know exactly when to use each.
⏱️
Payback Period Calculator
Run your numbers instantly and get your recovery timeline in seconds. Know when your investment pays for itself before you commit the capital.
The payback period is the amount of time it takes for an investment to generate enough cash flows to recover its initial cost.
How do you calculate the payback period?
Divide the initial investment by the annual cash flow. For example, a $10,000 investment that generates $2,000 per year has a payback period of 5 years.
What is a 'good' payback period?
Shorter payback periods are always better. Many companies have internal rules requiring new equipment or software to pay for itself within 2 to 3 years.
What are the limitations of the payback period?
Its biggest flaw is that it ignores the time value of money and ignores any profits that occur after the payback period has been reached.
What is the discounted payback period?
The discounted payback period fixes the main flaw of the standard calculation by discounting future cash flows to their present value before calculating how long it takes to break even.
#payback period calculation#investment recovery#capital budgeting#ROI timeline#break-even period#business investment analysis