How to Calculate Operating Expense Ratio for Your Business
Learn how to perform an operating expense ratio calculation to evaluate your business's operational efficiency. Discover formulas, industry benchmarks, and practical optimization strategies.
BT
Bizcalc Team
·June 15, 2026
Every business, regardless of size, industry, or location, exists in a delicate balance between generating income and consuming resources. While revenue growth often receives the majority of management attention, a business's ultimate sustainability depends on its operational efficiency—its ability to convert revenue into profit without letting day-to-day costs swallow the gains.
One of the most powerful and reliable metrics for measuring this balance is the Operating Expense Ratio (OER). Primarily used in real estate investment and corporate financial analysis, the OER measures operating expenses as a percentage of gross revenue. It reveals exactly how many cents of every dollar or pound earned are spent just to keep the doors open and the lights on.
Understanding how to perform an operating expense ratio calculation, interpret the results, and benchmark your performance against your industry is essential for any business owner, manager, or investor. This guide provides a comprehensive breakdown of the OER, the formula, step-by-step calculation instructions, industry benchmarks, and concrete strategies to optimize your operational efficiency.
📊
Operating Expense Ratio Calculator
Enter your operating expenses and gross revenue to instantly calculate your Operating Expense Ratio and evaluate your business's cost efficiency.
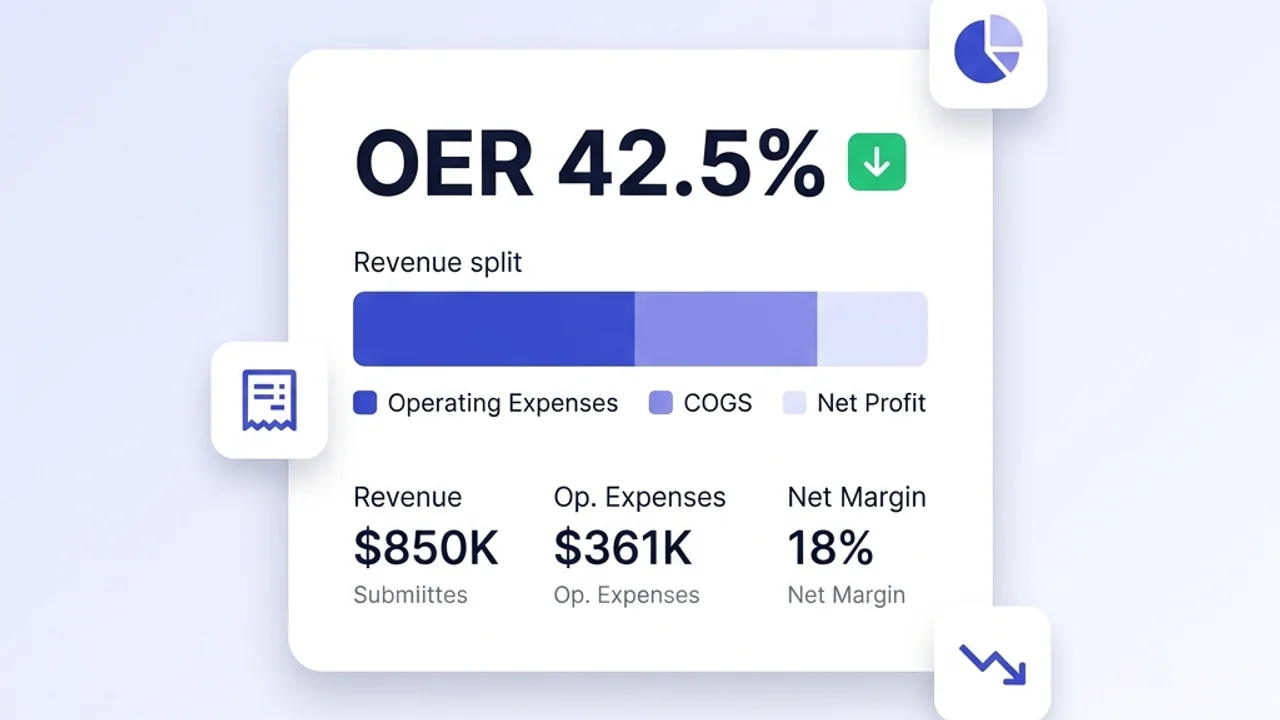
The Operating Expense Ratio (OER) is a cost-control metric that quantifies the relationship between a business’s operating expenses (OpEx) and its gross revenues. In simple terms, it tells you how expensive a business or an income-producing asset is to operate relative to the income it generates.
In general corporate finance, OER is used to assess operational efficiency and management performance. In real estate—where the metric is a cornerstone of property analysis—it is used to evaluate how much of a property’s rental income is consumed by maintenance, taxes, insurance, and utilities.
A lower OER indicates a highly efficient operation where expenses are tightly controlled, leaving a larger portion of income to cover debt service, capital improvements, taxes, and net profit. Conversely, a high OER suggests that the business or property is expensive to run, leaving it vulnerable to cash flow shortfalls if revenues decline.
OpEx vs. COGS vs. CapEx
To calculate OER accurately, it is critical to understand the distinction between three primary categories of business expenditure:
Operating Expenses (OpEx): These are the ongoing costs required for the day-to-day administration and operation of the business. Examples include rent, utilities, insurance, property taxes, marketing, administrative salaries, maintenance, and office supplies. OpEx is the numerator in the OER formula.
Cost of Goods Sold (COGS) / Cost of Sales: These are the direct costs attributable to the production or acquisition of the goods sold by the company. This includes raw materials, direct manufacturing labor, and inventory acquisition costs. COGS is not included in operating expenses for the purpose of OER in traditional corporate analysis, as it scales directly with production volume rather than operational overhead.
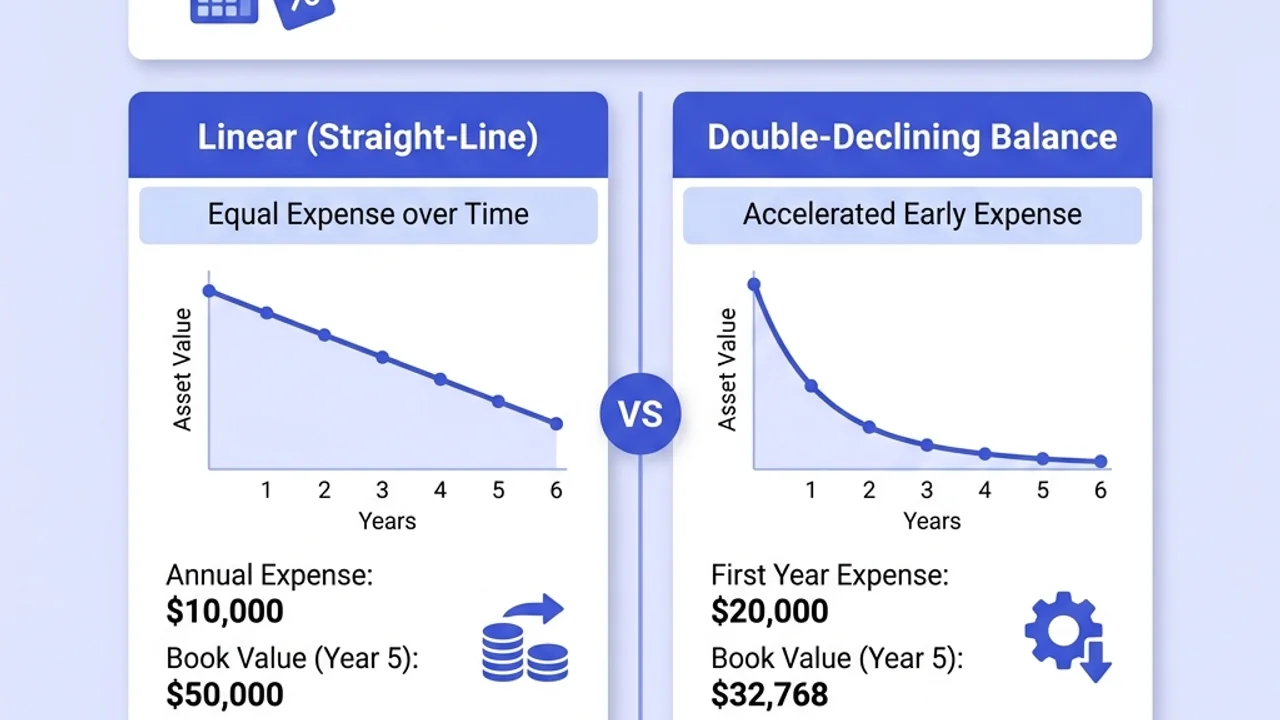
Capital Expenditures (CapEx): These are funds used by a company to acquire, upgrade, and maintain physical assets such as property, industrial buildings, or equipment. CapEx represents long-term investments that are depreciated over time on the balance sheet, rather than day-to-day operating expenses on the income statement. CapEx is excluded from the OER calculation.
The Operating Expense Ratio Formula
The fundamental formula for calculating the Operating Expense Ratio is straightforward:
Total Operating Expenses (OpEx): The sum of all non-direct costs required to operate the business or property over a specific period (usually monthly, quarterly, or annually).
Gross Revenue / Gross Income: The total amount of money brought in by the business or property before any deductions, expenses, or taxes are subtracted. In real estate, this is often referred to as Gross Operating Income (GOI), which is gross potential rental income minus vacancy and collection losses.
The result is expressed as a percentage. For example, an OER of 42% means that 42 cents of every dollar of revenue are spent on operating expenses, leaving 58 cents for direct costs (COGS), debt payments, capital expenditures, taxes, and profit.
The Real Estate OER Formula Variation
In real estate investment, the formula is tuned to focus specifically on property operations:
Here, Gross Operating Income (GOI) represents the actual rental income collected plus any secondary income (such as parking fees, laundry, or storage), accounting for vacancy rates. Debt service (mortgage payments) is explicitly excluded from property operating expenses, as it relates to the financing of the asset rather than its physical operation.
What Is Included and Excluded in Operating Expenses?
An accurate operating expense ratio calculation depends entirely on categorizing expenses correctly. Mislabeled items can artificially inflate or deflate your OER, leading to flawed business decisions.
Included in Operating Expenses (OpEx)
These items represent the day-to-day costs of running the business and should be included in your calculation:
Rent or Lease Payments: For offices, warehouses, retail spaces, or equipment leases.
Salaries, Wages, and Benefits: For administrative, managerial, sales, and support staff (excluding direct assembly or production labor, which belongs in COGS).
Utilities: Electricity, water, gas, waste disposal, internet, and phone services.
Insurance: General liability, professional indemnity, property insurance, and workers' compensation.
Property Taxes and Business Rates: Local taxes levied on business-owned real estate or business operations.
Marketing and Advertising: Campaigns, digital ads, agency fees, SEO, and promotional events.
Maintenance and Repairs: Ongoing upkeep of buildings, machinery, vehicles, and software systems.
Professional Services: Fees paid to accountants, lawyers, consultants, and IT service providers.
Office Expenses: Printing, software subscriptions, postage, and office supplies.
Travel and Entertainment: Business travel, client entertainment, and vehicle running costs.
Excluded from Operating Expenses (OpEx)
These items relate to cost of goods, financing, long-term capital assets, or taxes on profits, and must be excluded from the calculation:
Cost of Goods Sold (COGS): Direct materials, manufacturing labor, and shipping costs to acquire inventory.
Debt Service: Principal and interest payments on business loans, commercial mortgages, or lines of credit.
Capital Expenditures (CapEx): Purchase of new property, major building renovations, or new vehicle acquisitions (these are capitalized on the balance sheet, not expensed).
Income Taxes: Corporate income taxes or personal taxes paid on business profits.
Depreciation and Amortization: Non-cash expenses that write down the value of assets over time. (Note: While included in operating profit calculations under GAAP/IFRS, they are often excluded from cash-basis OER to focus on actual operational cash outflow).
Step-by-Step Guide: How to Calculate OER
To perform an operating expense ratio calculation, follow these four clear steps. For this example, we will calculate the annual OER for a mid-sized business.
Step 1: Gather Your Financial Statements
Locate your Profit and Loss (P&L) Statement (also called an Income Statement) for the period you want to analyze. Ensure the statement is finalized and covers a complete period, such as a fiscal year, a quarter, or a month.
Step 2: Sum Your Operating Expenses
Review the expense section of your P&L. Identify and sum all expenses that qualify as operating costs (OpEx), as outlined in the inclusion list above.
Scenario Expenses:
Administrative Salaries: $180,000
Office Rent: $48,000
Marketing & Advertising: $35,000
Utilities & Internet: $12,000
Business Insurance: $8,000
Maintenance & Software Subscriptions: $15,000
Office Supplies & General Admin: $7,000
Total Operating Expenses = $305,000
(Note: We verified that COGS of $400,000 and loan interest payments of $15,000 listed on the P&L were excluded from this step.)
Step 3: Identify Your Gross Revenue
Locate the "Top Line" of your P&L Statement. This represents the total revenue or sales generated by the business before any expenses are deducted.
Scenario Revenue:
Gross Sales Revenue: $850,000
Step 4: Apply the Formula
Divide your total operating expenses by your gross revenue, and multiply the result by 100.
OER = ($305,000 ÷ $850,000) × 100
OER = 0.3588 × 100 = 35.88%
Interpretation
This business has an Operating Expense Ratio of 35.88%. This means that for every $100 the business generates in revenue, $35.88 is spent on operating costs. The remaining $64.12 is available to cover the Cost of Goods Sold (COGS), service debt, invest in capital improvements, pay taxes, and generate net profit for the owners.
Worked Examples Across Different Sectors
Because business models vary, looking at how OER applies to different sectors helps illustrate how the metric functions in practice.
Example 1: The Service-Based Agency (e.g., Consulting or IT Agency)
Service-based businesses typically have low or zero COGS because they do not sell physical products. However, their operating expenses—specifically salaries and software—are usually high.
Analysis: An OER of 57.08% is common for service businesses. Since there is no physical inventory to purchase (COGS is negligible), the remaining 42.92% represents a strong operating margin, leaving ample space for owner distributions, reinvestment, and taxes.
Example 2: The E-Commerce Retailer
E-commerce businesses have high direct costs (COGS) to acquire or manufacture inventory and ship it to customers. However, they can keep operating costs relatively low by avoiding expensive retail storefronts.
Gross Annual Revenue: $2,500,000
Cost of Goods Sold (COGS): $1,400,000 (Excluded from OpEx)
Analysis: The OER is a low 23.20%. However, because COGS consumes 56.00% of revenue ($1.4M / $2.5M), the total costs (COGS + OpEx) are 79.20%, leaving a net operating profit margin of 20.80% before taxes and interest. This highlights why OER must always be analyzed alongside gross profit margins.
Example 3: The Commercial Real Estate Property (Apartment Building)
In property investment, OER is the standard tool for evaluating operational performance.
Gross Potential Rental Income: $320,000
Vacancy & Collection Losses: $16,000 (5%)
Gross Operating Income (GOI): $304,000
Operating Expenses:
Property Management Fees: $24,320 (8% of GOI)
Property Insurance: $12,000
Property Taxes: $38,000
Maintenance, Landscaping & Repairs: $30,000
Utilities (Landlord-paid areas): $16,000
Marketing & Leasing Costs: $5,000
Total OpEx: $125,320
OER = ($125,320 ÷ $304,000) × 100 = 41.22%
Analysis: The property operates at an OER of 41.22%. This is a healthy ratio for commercial residential real estate, which typically benchmarks between 35% and 50%. The remaining 58.78% ($178,680) represents the Net Operating Income (NOI), which is the cash flow available to pay the mortgage (debt service) and distribute to investors.
📊
Operating Expense Ratio Calculator
Plug in your own sector-specific revenue and expense numbers to check your current OER and compare it against industry standards.
What constitutes a "good" Operating Expense Ratio depends entirely on the industry you operate in. Comparing a software startup’s OER directly to a commercial real estate property or a retail grocery store is meaningless because their cost structures are fundamentally different.
Here is a summary of typical OER ranges across major sectors:
Similar to retail, direct material and labor costs reside in COGS, keeping the calculated OER relatively low.
OER vs. Other Key Financial Metrics
To get a complete picture of your business's financial health, the Operating Expense Ratio should not be viewed in isolation. It is most effective when paired with other key ratios.
1. Operating Profit Margin
The Operating Profit Margin measures the percentage of revenue remaining after paying for both the direct costs of production (COGS) and the operating expenses (OpEx).
Where Operating Income is Gross Revenue minus COGS and Operating Expenses.
The Connection: While OER focuses strictly on operating efficiency, the operating profit margin accounts for both production costs and operational costs. A business could have a very low OER (20%) but still be unprofitable if its COGS represents 85% of revenue.
2. EBITDA (Earnings Before Interest, Taxes, Depreciation, and Amortization)
EBITDA is a widely used measure of core operational profitability. It strips out non-operating factors like interest payments, tax structures, and non-cash accounting entries (depreciation and amortization).
The Connection: OER and EBITDA both seek to measure operational performance. By excluding interest, taxes, depreciation, and amortization from operating expenses during your OER calculation, you align the ratio closely with the cash-flow-focused view of profitability that EBITDA represents.
Related Calculator: Easily determine your earnings before interest and taxes using the EBITDA Calculator.
3. Break-Even Point
Your break-even point is the level of sales where total revenues exactly equal total costs (fixed operating expenses plus variable costs).
The Connection: A higher OER means operating expenses consume a larger portion of revenue, which directly raises the business's break-even point. Lowering your OER through expense optimization automatically lowers your break-even threshold, reducing your operational risk.
Related Calculator: Determine the exact volume of sales required to cover all costs with the Break-Even Calculator.
How to Optimize and Lower Your Operating Expense Ratio
If your operating expense ratio calculation reveals a figure that is higher than your industry benchmark or is trending upward over time, it is time to take action. There are two pathways to lowering your OER: reducing expenses or growing revenue faster than expenses.
1. Conduct a Cost Audit
Identify Waste: Review your general ledger line by line. Look for zombie subscriptions (software tools paid for but rarely used), duplicate software licenses, and underutilized space.
Negotiate Supplier Terms: Renegotiate contracts for recurring services such as utilities, insurance, waste management, and office leases. Seek quotes from competitors to leverage better rates.
Consolidate Operations: If you run multiple office locations or warehouses, evaluate whether consolidating space could reduce rent, utilities, and duplicate administrative staff.
2. Implement Process Automation
Leverage Technology: Replace manual administrative processes with software. Automated invoicing, payroll, scheduling, and customer support can significantly reduce the administrative hours required to run the business, lowering your staff overhead.
Integrate Systems: Ensure your software tools communicate. Data silos require manual data entry, which increases labor costs and errors.
3. Drive Revenue Efficiency (Operating Leverage)
Scale Revenue, Cap Overhead: The most effective way to lower OER is to grow top-line revenue without adding corresponding operational overhead. This is known as operational leverage. For example, a software company can sell 1,000 new subscriptions without needing to hire a new administrative team or double its office space.
Optimize Pricing: If your prices have not kept pace with inflation, your OER will naturally rise as your input costs increase while your revenue remains flat. Regularly review and adjust your pricing strategy.
4. Optimize Property Management (For Real Estate)
Preventative Maintenance: Regular upkeep of HVAC systems, roofing, and plumbing prevents minor issues from developing into costly emergency repairs that spike your annual OpEx.
Energy Efficiency: Invest in LED lighting, smart thermostats, and low-flow plumbing fixtures to permanently reduce landlord-paid utility costs.
Tenant Retention: Turnover is one of the most expensive aspects of property management. Keeping reliable tenants reduces marketing, cleaning, and leasing fee expenses.
Operating Expense Ratio Audit Checklist
Use this practical checklist quarterly or annually to audit your OER, ensure calculation accuracy, and monitor operational efficiency.
Collect the Correct Statements: Gather the finalized P&L (Income Statement) and balance sheet for the target period.
Exclude Cost of Goods Sold (COGS): Double-check that all direct manufacturing, inventory acquisition, and production labor costs are separated from operating expenses.
Exclude Financing and Capital Items: Verify that mortgage principal/interest (debt service), income taxes, and capital expenditures (CapEx) are not included in the OpEx total.
Confirm Depreciation Treatment: Decide whether to include or exclude depreciation and amortization. For a cash-flow-focused OER, exclude these non-cash expenses.
Calculate Gross Operating Income (For Real Estate): Ensure gross revenue accounts for actual collections, including vacancy losses and secondary income, rather than just theoretical maximum rental rates.
Run the OER Calculation: Apply the formula and calculate the percentage.
Perform a Trend Analysis: Compare this period’s OER against the previous four quarters or years. Is the ratio rising, falling, or stable?
Benchmark Against the Industry: Compare your percentage to published standards for your specific sector and size of business.
Identify Cost-Saving Targets: If the OER is rising, review the top three growing expense categories on the P&L and draft an optimization plan.
Review Pricing Structure: Assess whether a pricing adjustment is required to counteract rising operational costs and restore historical margins.
Final Thoughts
The Operating Expense Ratio is more than just a line item in a financial report; it is a clear window into the structural health of your business operations. By measuring exactly what it costs to generate revenue, the OER strips away the noise of high sales figures and reveals whether your business model is truly efficient.
A business that generates $1,000,000 in sales with an OER of 65% is often in a more precarious financial position than a business generating $700,000 with an OER of 35%. The latter operation has tighter cost controls, is more resilient to market downturns, and generates higher relative cash flow.
Run your calculations regularly, monitor the trends, and use the insights to build a leaner, more profitable, and more valuable business.
📊
Operating Expense Ratio Calculator
Generate a detailed Operating Expense Ratio analysis for your business or property. Start inputting your revenues and expenses now to discover your efficiency score.
The Operating Expense Ratio (OER) is a financial metric that compares the cost of running a business or property to the income it generates. It is calculated by dividing total operating expenses (OpEx) by gross revenue (or gross operating income in real estate) and multiplying by 100 to get a percentage. A lower OER indicates greater operational efficiency.
What is included in operating expenses for OER?
Operating expenses (OpEx) include day-to-day running costs such as rent or lease payments, utilities, insurance, property taxes, administrative salaries, maintenance, marketing, and office supplies. They exclude the Cost of Goods Sold (COGS), interest, principal debt repayments, income taxes, and major capital expenditures (CapEx).
Why does OER matter to business owners and investors?
OER is a key measure of operational efficiency and cost control. It helps business owners identify whether expenses are growing faster than revenues, assists investors in evaluating management efficiency, and provides a benchmark to compare performance against industry peers. In real estate, it directly impacts Net Operating Income (NOI) and property valuation.
What is a good Operating Expense Ratio?
A 'good' OER varies heavily by industry. In commercial real estate, an OER of 35% to 50% is typical. In retail or manufacturing, where Cost of Goods Sold (COGS) is high, the OER (excluding COGS) might be lower, whereas service-based and software (SaaS) businesses often have higher OERs because their primary expenses are operational (salaries, research, and marketing) rather than cost of physical goods.
How does OER differ from the operating profit margin?
OER measures the percentage of revenue consumed by operating expenses, whereas the operating profit margin measures the percentage of revenue left over after paying for both Cost of Goods Sold (COGS) and operating expenses. Under standard business accounting, they are complementary: a lower OER generally supports a higher operating profit margin.
#operating expense ratio calculation#operating expenses#opex#business efficiency#financial metrics