Productivity Calculator: How to Measure Employee Productivity
Learn how to measure employee productivity using proven formulas, KPIs, and tools. Understand output-based and efficiency-based methods to improve team performance.
BT
Bizcalc Team
·June 15, 2026
Every business runs on human effort. Whether you manage a five-person startup or a global enterprise with thousands of employees, understanding how much value each person generates relative to the time and resources they consume is one of the most important questions in management. Yet despite its importance, employee productivity measurement remains one of the most misunderstood and inconsistently applied practices in the workplace.
Many organizations still rely on proxy measures—hours logged, desk occupancy, email volume, or visible busyness—that have little correlation with actual output or business value. These outdated approaches can lead to micromanagement, disengagement, and ultimately worse performance. A rigorous, data-driven approach to measuring productivity tells you not just how busy your team is, but how effective they are.
This guide breaks down exactly how to measure employee productivity, from the core formula to role-specific metrics, industry benchmarks, and actionable strategies for improvement.
📈
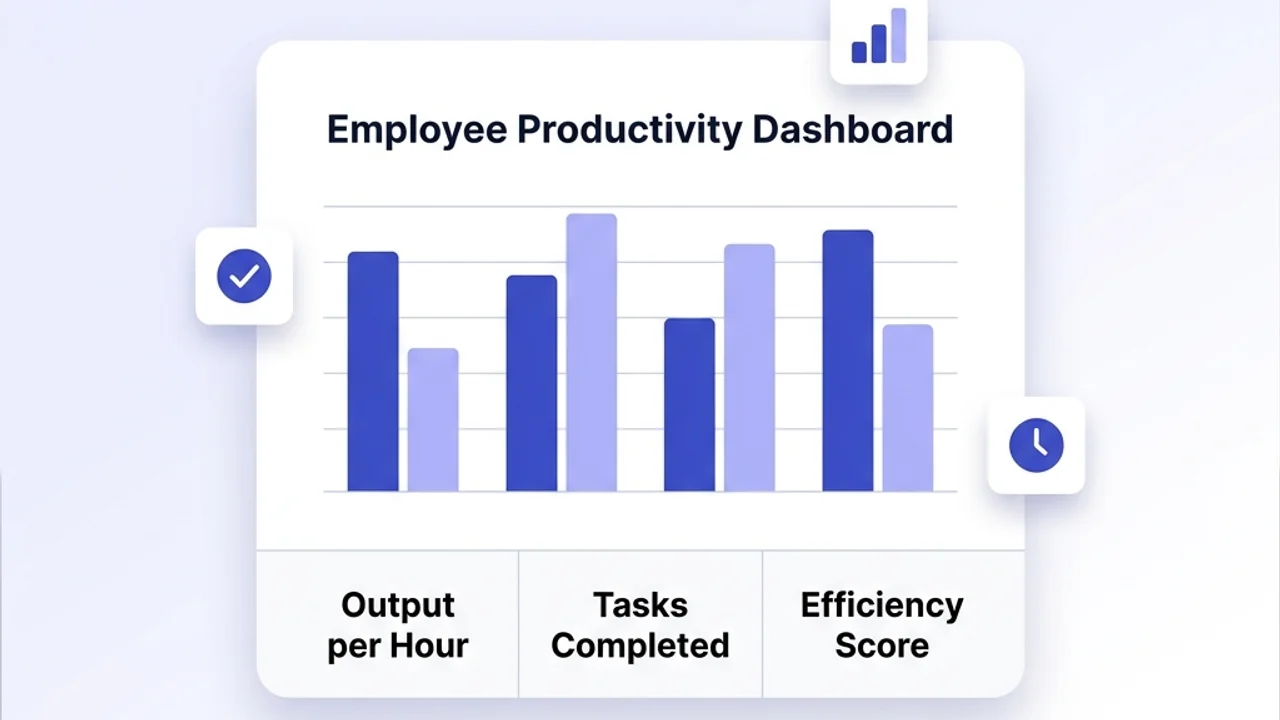
Productivity Calculator
Enter your team's output and input hours to instantly calculate productivity ratios, efficiency scores, and compare performance across periods or departments.
Employee productivity is a measure of the output generated by an employee or team relative to the inputs—typically time, labor, or cost—used to generate that output. In simple terms, it answers the question: How much valuable work does this person or team produce per unit of resource consumed?
Productivity is distinct from activity. An employee can be busy for eight hours and produce very little of value, or work a focused four hours and deliver exceptional results. Effective productivity measurement focuses on outputs and outcomes, not activity levels or time spent.
Output vs. Outcome: A Critical Distinction
Before selecting your measurement approach, it helps to understand two related but different concepts:
Output: A tangible, countable result of work. Examples: units manufactured, calls handled, articles written, lines of code shipped.
Outcome: The business result that the output contributes to. Examples: customer satisfaction score, revenue generated, defect rate reduction, market share growth.
Measuring only outputs can incentivize quantity over quality. Measuring only outcomes can make it difficult to connect individual effort to business results. The most effective productivity frameworks combine both.
The Core Productivity Formula
The foundational formula for measuring employee productivity is:
Productivity = Output ÷ Input
Where:
Output = the measurable result of work (units produced, revenue earned, tasks completed, etc.)
Input = the resource consumed to produce that result (hours worked, labor cost, headcount, etc.)
This ratio can be applied at the individual, team, department, or company level. A higher ratio indicates greater productivity—more output per unit of input.
Step 1: Define what counts as "output" for the role.
For a customer service agent, this might be tickets resolved. For a writer, it might be articles published. For a sales representative, it might be deals closed or revenue generated.
Step 2: Measure output over a defined period.
Choose a consistent timeframe—daily, weekly, monthly, or quarterly. Longer periods smooth out day-to-day variation and give a more reliable picture.
Step 3: Record total hours worked (input).
Use a time-tracking system, payroll records, or project management software logs. Exclude time spent on leave, training, or non-work activities to get actual productive hours.
Step 4: Apply the formula.
Divide total output by total input hours to get the productivity ratio for that period.
Step 5: Compare against a baseline.
A single data point is meaningless without context. Compare the current ratio against a previous period, a team average, or a department target to identify trends and anomalies.
Worked Examples
Example 1: Manufacturing (Units per Hour)
A production team of 10 workers each puts in 40 hours over a week. Together, they produce 3,200 finished units.
Productivity Ratio: 3,200 ÷ 400 = 8 units per labor hour
If the previous week's ratio was 7.2 units per labor hour, the team improved by approximately 11.1%. If the industry benchmark is 9 units per labor hour, there is still a gap to close.
Example 2: Customer Support (Tickets per Agent per Day)
A support team of 6 agents resolves 540 tickets over a 5-day workweek.
Total Input: 6 agents × 5 days = 30 agent-days
Total Output: 540 tickets
Productivity Ratio: 540 ÷ 30 = 18 tickets per agent per day
Pairing this with a customer satisfaction (CSAT) score ensures high volume does not come at the cost of quality.
Example 3: Sales Team (Revenue per Hour)
A sales representative works 45 hours in a week and closes $27,000 in new revenue.
Input: 45 hours
Output: $27,000
Sales Productivity: $27,000 ÷ 45 = $600 revenue per hour
Compared to a team average of $480 per hour, this rep is performing 25% above the benchmark—valuable insight for coaching, territory planning, and compensation review.
Example 4: Content Team (Articles per Week)
A content team of 4 writers produces 20 published articles per week.
Productivity per Writer: 20 ÷ 4 = 5 articles per writer per week
Adding an average word count or an organic traffic metric per article elevates this from an output metric to an outcome metric, revealing the quality dimension as well.
📈
Productivity Calculator
Model your team's productivity ratio across different roles and timeframes to surface performance trends and efficiency opportunities.
Different job functions require different productivity metrics. Using the wrong measure leads to unfair assessments and perverse incentives. Here is a practical guide organized by major role category.
Operations and Manufacturing
Metric
How to Calculate
Units per Labor Hour
Total Units ÷ Total Hours Worked
Cycle Time
Time from Start to Completion of One Unit
Yield Rate
Good Units ÷ Total Units Produced × 100%
Capacity Utilization
Actual Output ÷ Maximum Possible Output × 100%
On-Time Delivery Rate
Orders Delivered on Time ÷ Total Orders × 100%
Customer Service and Support
Metric
How to Calculate
Tickets Resolved per Day
Total Tickets Closed ÷ Number of Agent-Days
First Contact Resolution (FCR) Rate
Issues Resolved on First Contact ÷ Total Contacts × 100%
Single-metric productivity ratios are useful but incomplete. They capture one dimension of performance while ignoring others. Multi-factor productivity (MFP) models account for multiple inputs to give a more accurate picture of efficiency.
The Balanced Scorecard Approach
Developed by Kaplan and Norton, the Balanced Scorecard framework evaluates performance across four complementary dimensions:
Financial: Revenue per employee, profit per employee, cost per output unit
Customer: CSAT score, Net Promoter Score (NPS), customer retention rate
Internal Processes: Cycle time, error rate, task completion rate
Learning and Growth: Employee training hours, skill development targets, employee engagement score
Each dimension is assigned specific metrics and targets. Productivity is evaluated holistically rather than through a single number, preventing the common trap of gaming one metric at the expense of others.
OKR-Based Productivity Measurement
Objectives and Key Results (OKRs) provide a structured way to measure progress toward meaningful goals rather than raw output volumes. An example OKR for a content team:
Objective: Establish the company as a thought leader in HR technology.
Key Result
Target
Measurement Method
Publish 4 long-form guides per month
48 per year
Content management system
Achieve average article word count of 2,000+
Tracked weekly
CMS analytics
Reach 10,000 monthly organic readers
By Q4
Google Analytics
Earn 20 quality backlinks per quarter
80 per year
SEO tracking tool
Progress on each Key Result serves as a direct productivity indicator, with the Objective providing the context that makes each result meaningful.
Common Productivity Benchmarks
While benchmarks vary significantly by industry, company size, and geography, the following reference points provide a useful starting context.
Industry
Revenue per Employee (Annual)
Notes
Technology (Software)
$350,000 – $600,000
High due to scalable digital products
Financial Services
$200,000 – $400,000
Driven by leverage and automation
Professional Services
$120,000 – $250,000
Consulting, legal, accounting
Retail
$80,000 – $150,000
High headcount relative to revenue
Manufacturing
$100,000 – $250,000
Varies greatly by automation level
Healthcare
$90,000 – $180,000
Labor-intensive; outcomes matter more than revenue
These are illustrative benchmarks. Internal benchmarking—comparing a team's current ratio to its own historical ratios—is often more actionable than industry comparisons, because it controls for company-specific factors.
What Affects Employee Productivity?
Measuring productivity is only useful if you understand the levers that drive it. Research consistently identifies several factors with the greatest impact.
1. Clear Goals and Role Clarity
Employees who understand exactly what they are expected to accomplish and how success will be measured outperform those operating in ambiguity. Regular goal-setting conversations and documented performance expectations have a direct impact on output quality and volume.
2. Tools and Technology
The right tools dramatically multiply individual output. A developer with a modern IDE and automated testing pipelines can ship more reliable code per day than one working without these supports. Removing tool friction—slow software, manual data entry, poor communication platforms—is one of the highest-ROI productivity investments available to managers.
3. Workplace Environment
Physical and digital work environments affect concentration, collaboration, and cognitive load. Open-plan offices, constant notification interruptions, and back-to-back meetings fragment attention and reduce deep-work capacity. Organizations that structure schedules to protect focused work time consistently report higher creative and analytical output per employee.
4. Manager Quality
Research by Gallup consistently finds that manager quality is the single largest factor in employee engagement, and engagement is directly correlated with productivity. Effective managers provide regular feedback, remove blockers, advocate for their teams, and connect individual work to company purpose.
5. Employee Wellbeing
Chronic overwork, stress, and burnout destroy long-run productivity even when short-term output appears high. Organizations tracking employee wellbeing indicators alongside output metrics are better positioned to spot early warning signs and intervene before costly turnover or performance deterioration occurs.
6. Compensation and Recognition
Fair, competitive pay reduces distracting financial stress and signals that the organization values contribution. Non-monetary recognition—public acknowledgment, growth opportunities, flexible arrangements—also has measurable impact on discretionary effort and retention.
Productivity Measurement: Pitfalls to Avoid
Pitfall 1: Measuring Activity Instead of Output
Tracking hours logged, emails sent, or meetings attended measures presence, not productivity. Shift focus to what gets produced, not how long an employee sits at their desk.
Pitfall 2: Using a Single Metric in Isolation
Optimizing for one number almost always degrades another. A call center that measures only calls handled per hour will see handle time decrease as agents rush through interactions, often at the cost of first-contact resolution and customer satisfaction. Pair volume metrics with quality metrics.
Pitfall 3: Ignoring Role Differences
Comparing a senior strategist's productivity using the same metric as a data entry clerk is meaningless at best and demoralizing at worst. Ensure every role has productivity metrics that reflect the actual nature and seniority of the work.
Pitfall 4: Setting Static Benchmarks
A benchmark set three years ago may be irrelevant today due to changes in product complexity, team size, or market conditions. Review and recalibrate productivity targets at least annually.
Pitfall 5: Treating Measurement as Surveillance
When employees feel that productivity tracking is primarily about monitoring and catching underperformance rather than supporting growth and removing barriers, it generates anxiety and erodes trust. Communicate the purpose of measurement clearly—to support individuals, identify systemic blockers, and allocate resources fairly.
Productivity Improvement Checklist
Use this checklist to diagnose underperformance and identify targeted improvements:
Define clear output metrics for each role that are directly within the employee's control.
Set measurable baselines by tracking current productivity ratios over 4–8 weeks before making changes.
Identify top blockers by asking employees directly what prevents them from doing their best work.
Audit tool quality to ensure employees have modern, functional software and systems.
Evaluate meeting load and eliminate or shorten meetings that do not require real-time collaboration.
Protect deep work time by scheduling at least two to three uninterrupted hours per day for focused tasks.
Establish a feedback cadence with regular one-to-one conversations focused on goals, progress, and support.
Review compensation benchmarks to ensure pay is competitive and equitable, reducing distracting financial stress.
Track employee wellbeing alongside output metrics using pulse surveys or informal check-ins.
Recalibrate targets quarterly based on role evolution, team capacity changes, and business priorities.
How to Build a Productivity Measurement System
Implementing a formal, consistent productivity measurement process does not require expensive software. Here is a practical framework:
Phase 1: Define (Week 1–2)
Identify the three to five most important output metrics for each role in your organization. For each metric, document:
What specifically is being counted.
How it will be measured and by whom.
The data source (CRM, project management tool, HRIS, manual log).
The review cadence (weekly, monthly, quarterly).
Phase 2: Baseline (Weeks 3–6)
Collect data without making any changes or setting targets. Use this period to establish realistic baselines and identify any data quality issues in your measurement approach.
Phase 3: Set Targets
Using your baseline data and any available industry benchmarks, set improvement targets for the next quarter. Make targets specific, time-bound, and achievable—stretch goals motivate, but unreachable targets demoralize.
Phase 4: Monitor and Review
Review productivity metrics on the agreed cadence. Use team meetings to discuss trends collectively, not to single out individuals. Focus conversations on systemic root causes of underperformance rather than blame.
Phase 5: Improve and Iterate
Use data to prioritize investments in tools, training, process improvements, or staffing adjustments. Treat low productivity as a diagnostic signal, not a verdict. Adjust targets and metrics as roles and business priorities evolve.
If you need to model what different staffing levels or productivity scenarios mean for your labor budget, the Employee Cost Calculator can help you map headcount directly to total employment costs.
The Role of Technology in Productivity Measurement
Modern HR and operations platforms have made productivity tracking more automated and accurate. Common tools include:
The most valuable productivity systems integrate data from multiple tools into a unified dashboard so that managers can see the relationship between input (hours, headcount, cost) and output (revenue, tasks, quality) in one place.
Whichever tools you use, the guiding principle remains the same: measure what matters, not what is easy to measure.
📈
Productivity Calculator
Use our free Productivity Calculator to quantify output per hour, compare team productivity ratios, and track performance improvements over time.
What is the simplest formula to measure employee productivity?
The most widely used formula is: Productivity = Output ÷ Input. Output is the volume of work produced (units, revenue, tasks, etc.) and input is the resource consumed to produce it, usually hours worked. A higher ratio means greater efficiency.
What is a good productivity rate for employees?
A widely cited benchmark from industrial research suggests employees are productively engaged for about 60–80% of their working hours, with the remainder absorbed by meetings, context-switching, and administrative tasks. The ideal benchmark varies by role, industry, and company. What matters most is tracking your own baseline and measuring improvement over time.
How do you measure productivity for knowledge workers?
Knowledge workers (developers, writers, analysts, designers) do not produce easily countable physical units, so productivity is best measured through output metrics like tasks completed, project milestones hit, quality of deliverables, and target-versus-actual timelines. OKR frameworks and project management tools with time-logging are commonly used.
What is the difference between productivity and efficiency?
Productivity measures the volume of output relative to input (how much you produced). Efficiency measures how well resources were used to produce that output (how little you wasted). An employee can be highly productive (high output) but inefficient (using far more time than necessary). Optimizing both is the goal.
Can employee productivity be measured fairly across different roles?
Yes, but it requires role-specific metrics rather than a one-size-fits-all formula. A sales representative's productivity might be measured in revenue generated per hour, while a software developer's might be measured in story points completed per sprint. Define output and input metrics that are directly within the employee's control and reflect their actual job responsibilities.
#how to measure employee productivity#employee productivity#productivity metrics#workforce efficiency#output per employee#productivity formula