Cash Flow Projection: Why Every Small Business Needs One
Discover why a cash flow projection is essential for small business survival. Learn how to forecast cash flow, manage working capital, and avoid insolvency.
BT
Bizcalc Team
·June 16, 2026
Operating a small business requires managing multiple competing priorities simultaneously. From serving customers and refining product offerings to managing staff and coordinating marketing campaigns, daily tasks demand constant attention. Yet, beneath these operational requirements lies a single, non-negotiable financial tool: the cash flow projection. Small business viability relies on a steady balance between cash inflows and outflows, meaning that understanding liquidity is essential for survival.
Statistical analyses of corporate insolvencies consistently reveal that cash flow problems represent the primary driver of business closures. A company can operate with zero profit—or even at a net loss—for months or years under specific growth strategies, but it cannot survive a single day if it runs out of cash to pay payroll, rent, or critical suppliers. This reality highlights the vital importance of forecasting future financial resources.
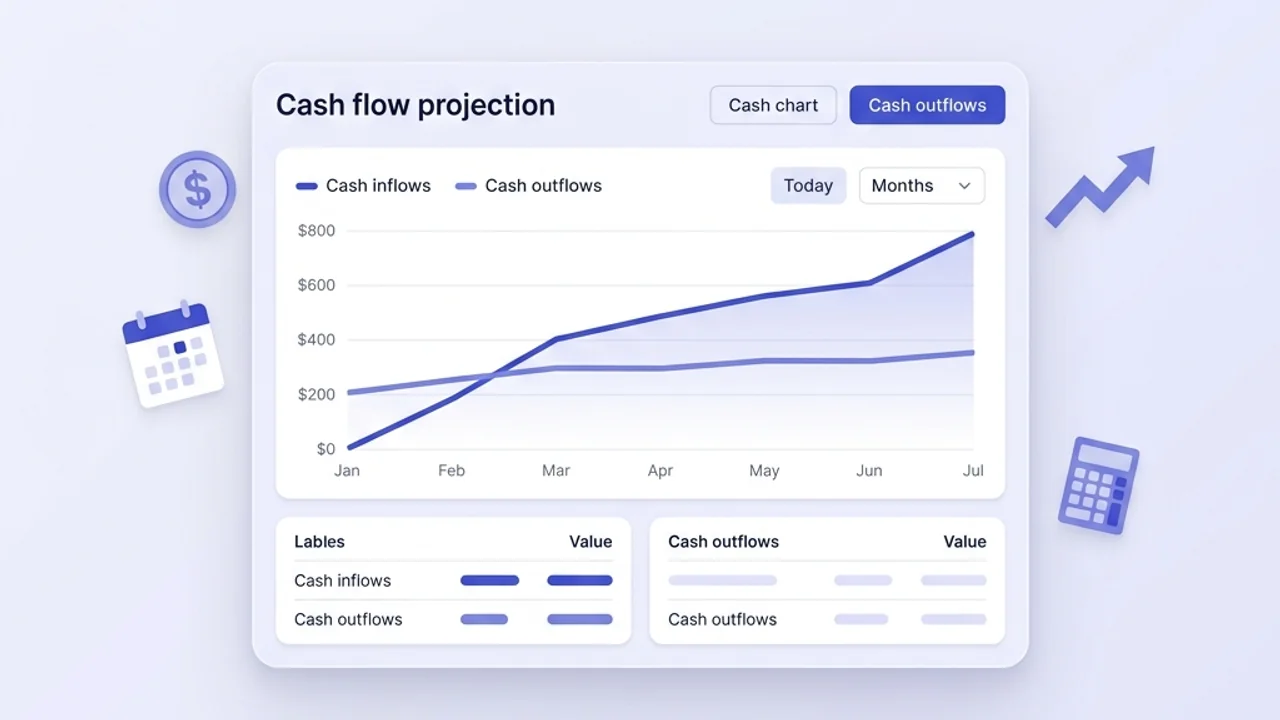
A cash flow projection small business owners rely on acts as an early warning system. By predicting the timing and volume of cash inflows and outflows, this financial tool allows you to look ahead, anticipate potential shortfalls, and implement corrective strategies before a minor liquidity tight spot escalates into a terminal operational crisis.
📊
Cash Flow Projection Calculator
Input your starting balances, expected sales collections, and operational expenses to map out your liquid cash availability.
A fundamental challenge in corporate finance is understanding that profit and cash are not identical. This distinction represents one of the most common traps for growing enterprises. Many entrepreneurs believe that because their profit and loss statement shows positive net income, their bank account will reflect the same success. This assumption is incorrect and dangerous.
Accrual Accounting vs. Cash Flow Reality
Most businesses use accrual-basis accounting for standard financial reporting. Under the accrual system, revenue is recognized and recorded when a sale occurs, and expenses are recorded when they are incurred. This method provides an accurate long-term view of a business model's viability. However, it does not reflect the movement of actual currency.
For example, if an enterprise signs a contract to deliver consulting services worth $10,000 in January and invoices the customer with 60-day payment terms, the profit and loss statement records $10,000 of revenue in January. If the variable cost to deliver those services (such as contractor payments) is $4,000, the profit and loss statement shows a healthy net profit of $6,000.
However, in terms of actual liquidity:
In January, cash inflow from this transaction is $0.
In January, cash outflow to pay contractors is $4,000.
The transaction creates a net cash deficit of $4,000 for that month.
The $10,000 cash inflow will not arrive until March, assuming the customer pays on time.
If the business does not have sufficient cash reserves to cover the $4,000 outflow in January, it faces immediate insolvency, despite having a profitable project on the books.
Working Capital Lockup
Another major variance between cash and profit involves inventory and capital expenditures.
Inventory Purchases: When a retail or manufacturing company buys raw materials or finished goods, the purchase is not immediately expensed on the profit and loss statement. Instead, it is recorded as an asset on the balance sheet. The expense is only recognized as Cost of Goods Sold (COGS) when the inventory is actually sold. However, the cash used to purchase that inventory leaves the bank account immediately. A business that buys $20,000 of stock to prepare for a seasonal sales peak will see its cash balance drop by $20,000 instantly, even though its profit and loss statement remains unaffected until those items sell.
Accounts Receivable: When sales grow rapidly, accounts receivable balances expand. Unless customers pay immediately at the point of sale, rapid revenue growth requires a proportional increase in working capital to fund the delay between manufacturing a product and receiving payment.
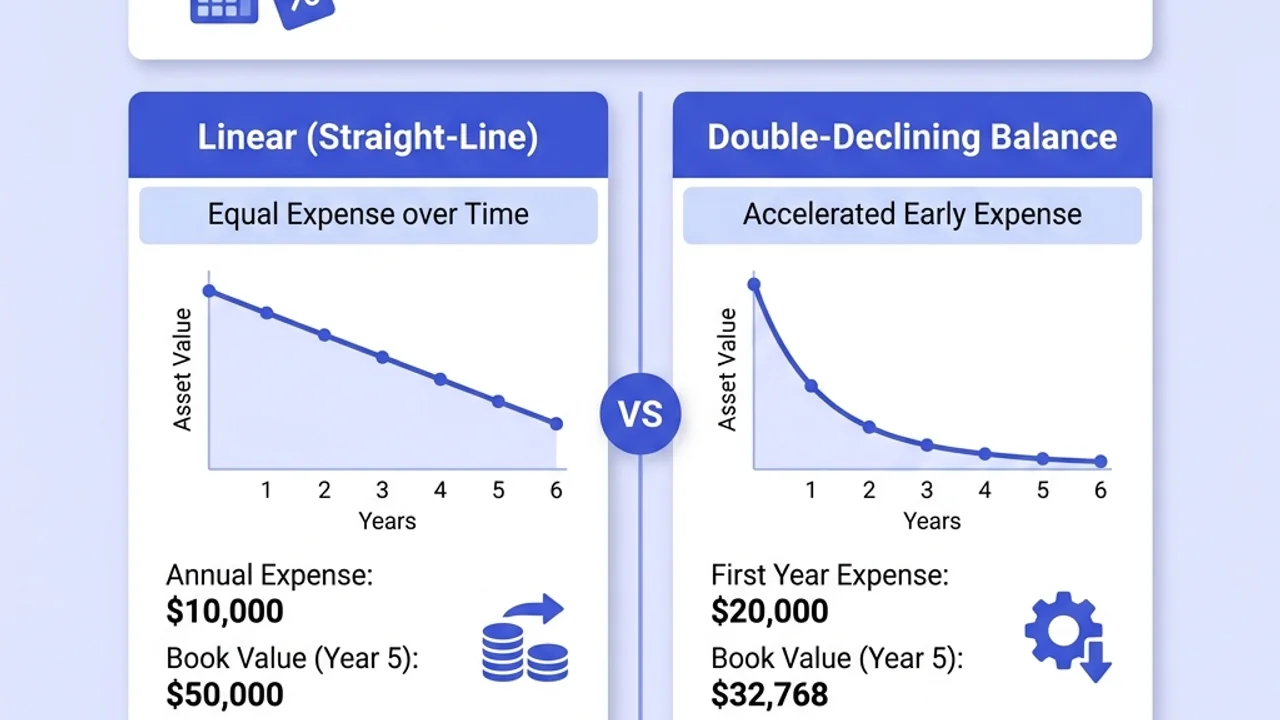
Capital Expenditures: Buying a delivery van or manufacturing equipment requires a large cash outlay. On the profit and loss statement, this cost is spread out over several years through depreciation. Yet, the entire purchase price must often be paid upfront, draining the cash balance immediately.
To analyze your current liquidity position, check the Working Capital Calculator to evaluate how much current capital is tied up in net operating assets.
Why Small Businesses Experience Cash Crises
Understanding the drivers of cash deficits is the first step in prevention. Liquidity problems rarely happen without warning; they are usually the predictable outcome of specific structural issues.
1. Extended Payment Terms and Late Collections
Offering credit terms to business-to-business (B2B) clients is a standard competitive practice. Yet, when clients push payment cycles from 30 days to 60 or 90 days, the selling business essentially acts as an interest-free lender. Furthermore, invoice payment delays are common. If your customers pay late, your cash inflows shift, disrupting the schedule for meeting your own obligations.
2. Overtrading (Growing Too Fast)
Growth requires cash. Expanding a business requires hiring personnel, increasing marketing spend, leasing larger spaces, or purchasing additional stock. If an enterprise doubles its sales, it must fund the production costs for twice as many orders before collecting cash from those new customers. Without planning, a rapid spike in customer demand can drain cash reserves, leading to a business collapse during a period of record sales.
3. High Fixed Overhead Costs
A high proportion of fixed costs creates operational risk. Fixed expenses, such as commercial rent, permanent employee salaries, and equipment leases, must be paid regardless of sales performance. If revenue drops during a slow season, these expenses remain constant, causing rapid cash depletion.
4. Poor Inventory Management
Holding excess inventory locks up cash that could be used for operating expenses. Overstocked items also incur holding costs, risk obsolescence, and represent tied-up capital that yields no return. Monitoring inventory efficiency using the Inventory Turnover Calculator helps identify how quickly cash invested in stock is recovered.
The Structure of a Cash Flow Projection
A cash flow projection small business owners can manage is structured around four primary components. It is compiled chronologically, usually on a month-by-month basis, over a 12-month horizon.
Start of Month
Opening Cash Balance
Actual liquid cash available in bank accounts
+
Cash Inflows
Cash Sales Receipts
Collections of Accounts Receivable (customer payments)
Loans, Grants, or Capital Investments
−
Cash Outflows
Supplier & Inventory Payments
Payroll, Rent, Utilities, Insurance
Tax Payments (VAT, GST, Corporate Taxes)
Debt Repayments & Capital Expenditures
Net Cash Flow
Total Inflows − Total Outflows
End of Month
Closing Cash Balance
Opening Balance + Net Cash Flow
1. Opening Cash Balance
This is the amount of reconciled, cleared cash in your business bank accounts at the beginning of the projection period. It represents your starting capital and must not include pending deposits, credit card limits, or uncollected receivables.
2. Cash Inflows
Inflows include all cash entering the business during the specified period. It is critical to record these payments in the month they hit the bank account, not the month the sale occurred. Inflows are divided into:
Operating Receipts: Collections from cash sales and payments from outstanding customer invoices (accounts receivable).
Non-Operating Cash: Bank loan proceeds, equity investments, tax refunds, asset sales, and government grants.
3. Cash Outflows
Outflows represent all cash leaving the business. Like inflows, outflows must be recorded when the money is paid, not when the invoice is received. Outflows include:
Direct Costs: Payments to suppliers for raw materials, finished stock, or direct production labor.
Operating Expenses: Fixed costs such as rent, utilities, insurance, software licenses, administrative payroll, and marketing spend.
Capital Expenditures: Cash purchases of equipment, machinery, or property.
Financial & Tax Payments: Loan principal and interest payments, sales tax, corporate tax, and owner draws or dividends.
4. Ending Cash Balance
This is the final cash balance at the end of the month. It is calculated by adding the net cash flow (total inflows minus total outflows) to the opening cash balance.
The ending cash balance for one month automatically becomes the opening cash balance for the next month, linking the projection period into a continuous model. Business owners can compile these values manually or use the Cash Flow Projection Calculator to dynamically evaluate cash patterns under various scenarios.
📊
Cash Flow Projection Calculator
Run what-if scenarios to analyze how changes in customer payment terms affect your monthly cash position.
Step-by-Step Guide to Creating a Cash Flow Projection
Developing a projection requires realistic calculations and conservative estimates. Follow this structured process to build a practical projection.
Step 1: Set the Projection Horizon and Reconcile Starting Cash
Determine the timeframe for your forecast. A 12-month projection is standard for annual planning, but a 13-week weekly projection is more effective for businesses in critical cash positions. Next, log your exact cash balances across all checking, savings, and merchant gateway accounts to establish your starting point.
Step 2: Forecast Cash Inflows with Real Collections Delays
Do not assume that all sales convert to cash immediately. Divide your historical sales into cash payments (paid immediately via credit card or bank transfer) and credit payments (paid on terms like Net 30 or Net 60).
If your credit sales average $50,000 per month, and your collection history shows that 60% of customers pay in 30 days, 30% pay in 60 days, and 10% pay in 90 days, map the cash inflows accordingly:
Month 1 Sales ($50,000):
$30,000 collected in Month 2
$15,000 collected in Month 3
$5,000 collected in Month 4
Apply this pattern across the projection period, factoring in any seasonal sales fluctuations.
Step 3: Estimate Operating Cash Outflows
Review bank statements and supplier agreements to list recurring and variable expenses.
Schedule Payroll and Fixed Expenses: Rent, utilities, hosting fees, and base salaries generally occur on fixed schedules. Record them in the appropriate monthly columns.
Schedule Inventory Purchases: Estimate when stock must be purchased to fulfill projected sales. If you expect a sales spike in Month 4, and your lead time to buy stock is two months, record the inventory cash outflow in Month 2.
Include Seasonal and Annual Payments: Do not omit less-frequent outflows like annual insurance premiums, quarterly tax filings, or bi-annual software renewals.
Step 4: Calculate Net Cash Flow and Ending Balances
Subtract the total monthly cash outflows from the total monthly cash inflows. Add this net cash flow to the starting cash balance to determine the ending cash balance. Verify that this ending balance becomes the starting balance for the subsequent month.
Step 5: Conduct Sensitivity Analysis and Stress Testing
Create alternative scenarios to test the resilience of your cash position:
Late Collection Scenario: What happens to your ending cash balance if your primary customer delays payment by 30 days?
Revenue Decline Scenario: How does a 20% drop in sales affect your ability to cover fixed overheads?
Increased Outflow Scenario: Can the business afford a sudden 15% increase in raw material costs without requiring external financing?
A Practical 6-Month Cash Flow Projection Example
To illustrate this process, let's examine a 6-month cash flow projection for a service and product-distribution business.
This business starts with an opening cash balance of $15,000. It projects sales of $40,000 in Month 1, growing by $5,000 each month. Customers are billed on Net 30 terms, meaning cash from credit sales is collected in the month following the sale. The business must also make a bulk inventory purchase of $25,000 in Month 3 to support projected growth.
6-Month Cash Flow Projection Model
Line Item
Month 1
Month 2
Month 3
Month 4
Month 5
Month 6
Opening Cash Balance
$15,000
$16,500
$21,000
-$5,500
$1,500
$10,000
Cash Inflows
Cash Sales (30% of sales)
$12,000
$13,500
$15,000
$16,500
$18,000
$19,500
Credit Collections (Net 30)
$20,000
$28,000
$31,500
$35,000
$38,500
$42,000
Other Inflows (Grants/Loans)
$0
$0
$0
$15,000
$0
$0
Total Inflows
$32,000
$41,500
$46,500
$66,500
$56,500
$61,500
Cash Outflows
Inventory Purchases
$8,000
$10,000
$25,000
$12,000
$14,000
$15,000
Operating payroll
$12,000
$12,000
$13,000
$13,000
$13,000
$14,000
Rent and Office Utilities
$4,500
$4,500
$4,500
$4,500
$4,500
$4,500
Marketing Expense
$3,000
$3,500
$4,000
$4,000
$4,500
$5,000
Tax Liabilities
$0
$4,000
$0
$15,000
$0
$4,000
Equipment Purchases
$3,000
$3,000
$26,500
$1,000
$12,000
$1,000
Total Outflows
$30,500
$37,000
$73,000
$59,500
$48,000
$43,500
Net Cash Flow
$1,500
$4,500
-$26,500
$7,000
$8,500
$18,000
Closing Cash Balance
$16,500
$21,000
-$5,500
$1,500
$10,000
$28,000
Analysis of the 6-Month Scenario
Reviewing the table reveals critical insights about managing cash:
The Profitability Illusion: On paper, the business is growing and profitable. Revenues are increasing steadily, and margins are stable.
The Month 3 Deficit: In Month 3, the business faces a cash deficit of -$5,500. This shortfall is driven by two main factors: the $25,000 inventory purchase needed to support future sales, and a large equipment purchase of $26,500.
The Month 4 Recovery: In Month 4, the business recovers due to a $15,000 cash injection (such as a working capital loan or grant) and higher sales collections.
Without a cash flow projection, this business owner might have signed the purchase orders for the equipment and inventory in Month 3, only to realize mid-month that they could not meet payroll. By forecasting this shortage, the owner can take proactive steps:
Negotiate to split the inventory payment into two installments (e.g., 50% in Month 3, 50% in Month 4).
Postpone the equipment purchase until Month 5 or Month 6, when cash reserves are higher.
Secure a short-term line of credit in Month 2 to cover the temporary Month 3 shortfall.
Strategies to Optimize and Protect Your Cash Flow
Creating a projection helps identify problems, but managing cash flow requires active operational adjustments. Here are key strategies to optimize your cash cycle.
1. Optimize Accounts Receivable (Inflows)
To accelerate cash inflows, focus on collecting payments from your customers more quickly:
Invoice Immediately: Do not delay sending invoices. Implement automated invoicing systems that bill clients the moment a service is completed or a product is shipped.
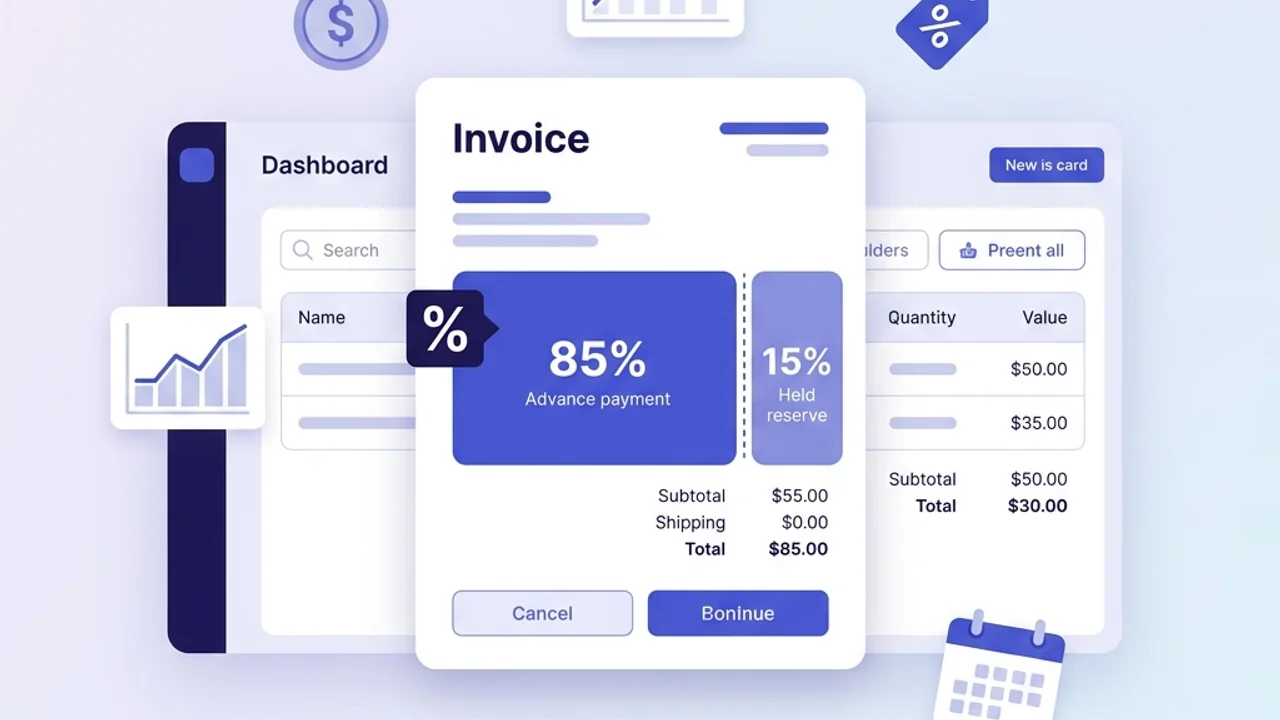
Offer Early Payment Incentives: Provide a small discount (such as 1% or 2% off the invoice total) if the customer pays within 10 days instead of the standard 30 days. You can use the Invoice Discount Calculator to evaluate if the cost of the discount is offset by the benefit of having cash sooner.
Implement Late Payment Penalties: Clearly state interest charges for late payments on your contracts and invoices, and apply them consistently.
Accept Modern Payment Methods: Provide options for instant credit card payments, digital wallets, or direct bank feeds to make it easier for clients to pay invoices.
2. Control Accounts Payable (Outflows)
Managing cash outflows is just as important as accelerating inflows. Keep cash in your bank account longer using these practices:
Use Full Credit Terms: If a supplier offers Net 30 terms, pay them on day 30, not day 5. This allows you to retain liquid capital for as long as possible.
Negotiate Better Terms: Once you have a reliable payment history, negotiate with key suppliers to extend terms from 30 days to 45 or 60 days.
Align Payment Cycles: Try to align your supplier payment dates with your major customer collection periods to prevent cash gaps.
3. Improve Inventory Management
Inventory represents cash that is temporarily unavailable. Optimizing stock levels frees up working capital:
Implement Just-In-Time (JIT) Purchasing: Where possible, order inventory closer to the actual delivery date to minimize warehouse storage time.
Liquidate Slow-Moving Stock: Run promotions or bundle products to sell obsolete inventory, converting idle stock back into cash even if you have to sell at cost.
4. Build a Cash Buffer and Secure Financing Early
Do not wait for a cash crisis to apply for financing. Banks are unlikely to lend to businesses that are running out of cash.
Secure a Line of Credit: Establish a revolving business line of credit while your financial statements are strong. Use it as a safety net for seasonal cash gaps.
Maintain Reserves: Aim to keep three to six months of operating expenses in cash reserves to manage unexpected revenue drops.
The Role of Key Financial Metrics
To maintain a healthy cash position, monitor these critical metrics alongside your cash flow projection.
Burn Rate
Burn rate is the rate at which a company consumes its cash reserves to cover operating deficits. It is a critical metric for early-stage companies and businesses undergoing rapid expansion.
Net Burn Rate Formula:(Starting Cash Balance - Ending Cash Balance) / Period Months
Use the Burn Rate Calculator to track how many months of cash runway your business has left before requiring new revenues or financing.
Operating Expense Ratio (OER)
This ratio measures your operational efficiency by comparing total operating expenses to gross revenues.
Operating Expense Ratio Formula:Total Operating Expenses / Gross Revenue
A rising OER indicates that your fixed overheads are consuming a larger share of revenue, increasing cash flow risk during sales downturns. Monitor this trend using the Operating Expense Ratio Calculator.
Profit Margins
While cash flow is vital, your pricing must generate long-term profitability. Use the Profit Margin Calculator to verify that your unit margins cover both variable delivery costs and a portion of your fixed overheads.
Small Business Cash Flow Checklist
Use this checklist to implement and maintain a reliable cash forecasting process:
Reconcile all bank, gateway, and credit accounts weekly.
Categorize and track all fixed overhead expenses separate from variable costs.
Calculate your average accounts receivable collection time (Days Sales Outstanding).
Set a recurring calendar reminder to update your 12-month projection on the first business day of every month.
Run a worst-case scenario analysis with a 20% sales drop or a 30-day payment delay from major accounts.
Review your inventory turnover rate quarterly to identify and liquidate slow-moving stock.
Maintain a separate tax reserve account to hold sales tax, VAT, and corporate tax payments, preventing them from being used for daily operations.
Establish a business credit line or working capital facility while cash reserves are healthy.
Maintaining a cash flow projection small business owners can trust is not a one-time exercise; it is an active management practice. By maintaining clear visibility over your future cash flows, you can make informed decisions about hiring, inventory, and investment, ensuring your business has the resources to grow.
🔥
Burn Rate Calculator
Track your monthly operating cash consumption and calculate your remaining runway.
What is a cash flow projection for a small business?
A cash flow projection is a forward-looking financial document that estimates the cash inflows and outflows of a business over a specific period, typically 12 months. It helps business owners anticipate future cash balances, identify potential cash shortages, and make informed decisions about spending, hiring, and borrowing.
How does a cash flow projection differ from a profit and loss budget?
A profit and loss budget measures revenues and expenses when they are incurred (accrual accounting), whereas a cash flow projection measures when cash actually enters and leaves the bank account (cash accounting). A business can show a paper profit on its budget while running out of physical cash due to unpaid customer invoices or heavy inventory investments.
How often should a small business update its cash flow projection?
A small business should review and update its cash flow projection at least once a month, comparing projected figures with actual bank balances. For businesses experiencing rapid growth, seasonal sales, or tight cash constraints, weekly updates are recommended to manage short-term liquidity challenges.
What should a business do if its cash flow projection shows a deficit?
If a projection forecasts a cash deficit, the business should take proactive steps such as accelerating invoice collections, renegotiating supplier payment terms, delaying capital expenditures, or securing a business line of credit. Working capital adjustments, like reducing inventory levels, can also quickly free up cash.
Are tax obligations included in a cash flow projection?
Yes, all actual tax cash payments, including corporate income taxes, value-added taxes (VAT/GST), payroll taxes, and sales taxes, must be included in the projection. These outflows should be scheduled in the specific months they are paid to the tax authorities, rather than spread out monthly as accounting accruals.
#cash flow projection small business#cash flow forecasting#working capital#business liquidity#financial planning