10 Financial Ratios Every Small Business Owner Should Track
Discover the 10 essential financial ratios for small business owners: track liquidity, profitability, leverage, and asset efficiency to protect cash flow.
BT
Bizcalc Team
·September 9, 2026
Quick Answer & Key Summary
Quick Answer: Financial ratios convert raw balance sheet and income statement data into standardized metrics across liquidity, profitability, leverage, and operational efficiency to diagnose company health and solvency.
• Key Ratios & Formulas: Current Ratio (Current Assets ÷ Current Liabilities), Net Margin ([Net Income ÷ Revenue] × 100), Debt-to-Equity (Liabilities ÷ Equity), and ROE (Net Income ÷ Equity). • Rule of Thumb / Benchmark: Maintain a Current Ratio between 1.5x–2.0x, Debt-to-Equity under 2.0x, and review liquidity monthly and leverage quarterly.
Operating a growing business without monitoring key financial metrics is like navigating an aircraft in dense fog without cockpit instruments. A founder might glance at their bank account balance every morning, see positive cash deposits, and assume commercial operations are thriving. Yet beneath the surface of top-line revenue, uncollected invoices can age into uncollectible bad debt, fixed overhead can outpace gross margins, and debt service obligations can quietly drain working capital reserves.
Understanding financial ratios small business owners need is the single most effective way to eliminate financial blind spots. Accounting reports—the Balance Sheet, the Profit and Loss (Income) Statement, and the Cash Flow Statement—contain exhaustive data, but raw numbers alone do not tell you whether performance is improving or deteriorating. Financial ratios transform raw figures into meaningful diagnostic relationships. They allow you to compare your enterprise against industry benchmarks, track internal efficiency trends over time, and evaluate creditworthiness from the perspective of commercial lenders and equity investors.
By mastering ten core ratios spanning liquidity, profitability, leverage, and asset efficiency, entrepreneurs can steer their companies away from insolvency traps and build durable, compounding enterprises.
💧
Current Ratio Calculator
Check your business liquidity instantly and discover whether your current assets adequately cover upcoming short-term liabilities.
Master Comparison: The 10 Essential Financial Ratios at a Glance
Financial ratios group naturally into four functional pillars. Each pillar addresses a specific operational question regarding enterprise health, capital structure, and risk exposure.
Pillar / Category
Financial Ratio
Standard Formula
Typical Healthy Target
Primary Business Diagnostic
Liquidity
1. Current Ratio
Current Assets ÷ Current Liabilities
1.5x – 2.5x
Short-term bill-paying capability over the next 12 months.
Liquidity
2. Quick Ratio (Acid-Test)
(Cash + Marketable Securities + Receivables) ÷ Current Liabilities
1.0x – 1.5x
Immediate liquidity without relying on selling inventory.
Liquidity
3. Working Capital
Current Assets − Current Liabilities
Substantially Positive (>0)
Total dollar buffer available to fund daily operational cycles.
Profitability
4. Gross Profit Margin
[(Revenue − Cost of Goods Sold) ÷ Revenue] × 100
Sector dependent (30% – 60%+)
Pricing power and raw production/fulfillment efficiency.
Profitability
5. Net Profit Margin
(Net Income ÷ Total Revenue) × 100
8% – 15%+
Percentage of top-line sales retained after all operating costs.
Profitability
6. Operating Expense Ratio
(Total Operating Expenses ÷ Gross Revenue) × 100
60% – 80% (Lower is better)
Control of fixed administrative overhead and operational drag.
Leverage & Solvency
7. Debt-to-Equity (D/E)
Total Liabilities ÷ Shareholders' Equity
1.0x – 2.0x (Under 2.5x)
Reliance on debt financing versus founder/retained capital.
Leverage & Solvency
8. Interest Coverage Ratio
Operating Income (EBIT) ÷ Annual Interest Expense
3.0x – 5.0x+
Cushion available to service loan interest from operating profit.
Efficiency & Return
9. Return on Assets (ROA)
(Net Income ÷ Total Assets) × 100
5% – 10%+
Management effectiveness at generating profit from asset base.
Efficiency & Return
10. Return on Equity (ROE)
(Net Income ÷ Shareholders' Equity) × 100
15% – 25%+
Earning power generated on capital invested by business owners.
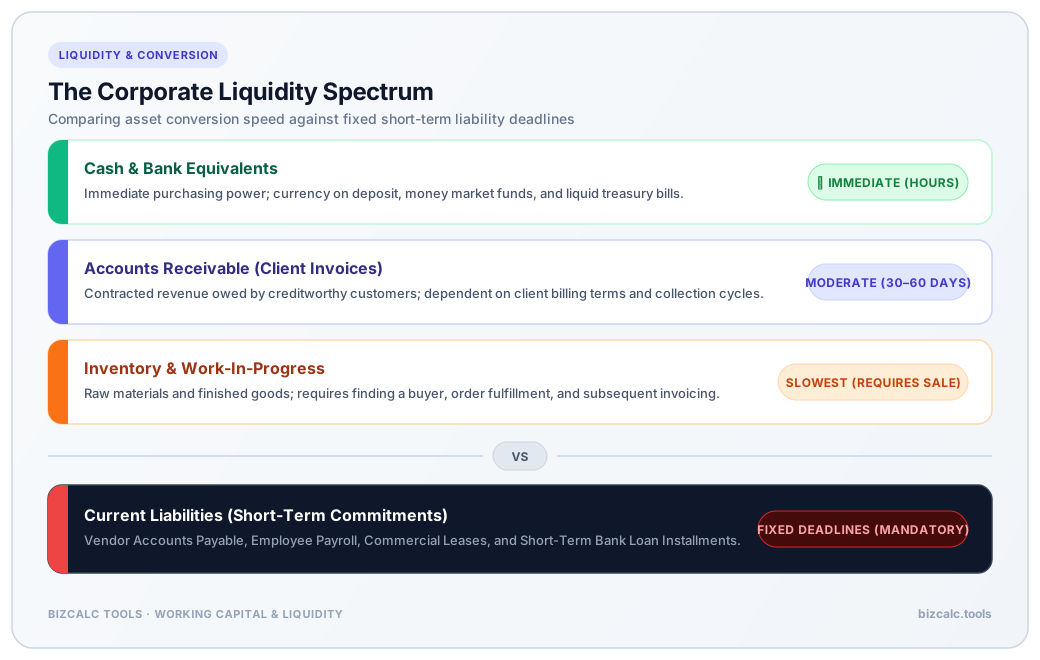
Liquidity represents the lifeblood of small business survival. More commercial enterprises fail from cash flow starvation than from lack of gross profitability. Liquidity ratios measure your ability to convert near-term assets into cash to satisfy short-term financial obligations as they come due.
1. The Current Ratio
The Current Ratio evaluates whether a company holds enough short-term assets (cash, accounts receivable, inventory, and short-term prepayments) to cover all liabilities due within the next twelve months (accounts payable, short-term debt installments, payroll obligations, and accrued taxes).
Current Ratio = Current Assets ÷ Current Liabilities
Practical Worked Example
Consider an independent commercial equipment maintenance company with the following balance sheet line items:
Cash and Bank Reserves: $35,000 / £28,000 / €32,000
Below 1.0x: Severe warning sign. The company does not possess enough short-term assets to pay its upcoming obligations over the next year. It risks technical insolvency without external capital injections.
1.2x to 1.5x: Acceptable for high-cash-velocity businesses (e.g., retail or restaurants with daily point-of-sale customer receipts).
1.5x to 2.5x: Healthy target range for most commercial B2B enterprises, providing a safe operating buffer against delayed client payments.
Above 3.0x: While safe, an excessively high ratio often signals inefficient asset utilization—such as holding surplus idle cash in zero-interest checking accounts or hoarding obsolete inventory.
While the Current Ratio includes all short-term assets, inventory cannot always be liquidated quickly without steep discounts. The Quick Ratio removes inventory and prepaid expenses from the numerator, focusing exclusively on "quick assets"—cash, marketable securities, and liquid trade receivables.
Quick Ratio = (Cash & Cash Equivalents + Marketable Securities + Accounts Receivable) ÷ Current Liabilities
A Quick Ratio of 1.67x confirms that even if parts inventory sales froze completely, the enterprise could pay off 100% of its current liabilities and still retain $40,000 in liquid reserves. Conservative commercial bankers place heavy reliance on the Quick Ratio when evaluating short-term credit lines.
3. Net Working Capital
Working capital is not expressed as a multiple; it is the absolute net dollar, pound, or euro surplus remaining after subtracting current liabilities from current assets. It represents the operating fuel required to finance inventory replenishment, cover payment lag periods, and bridge supplier credit terms.
Net Working Capital = Current Assets − Current Liabilities
Practical Worked Example
Current Assets: $120,000
Current Liabilities: $60,000
Net Working Capital: $120,000 − $60,000 = +$60,000
A positive working capital cushion of $60,000 protects the business against sudden supplier price increases or extended client payment cycles. When working capital dips into negative territory, a business begins relying on credit card debt, supplier grace periods, or expensive merchant cash advances to survive.
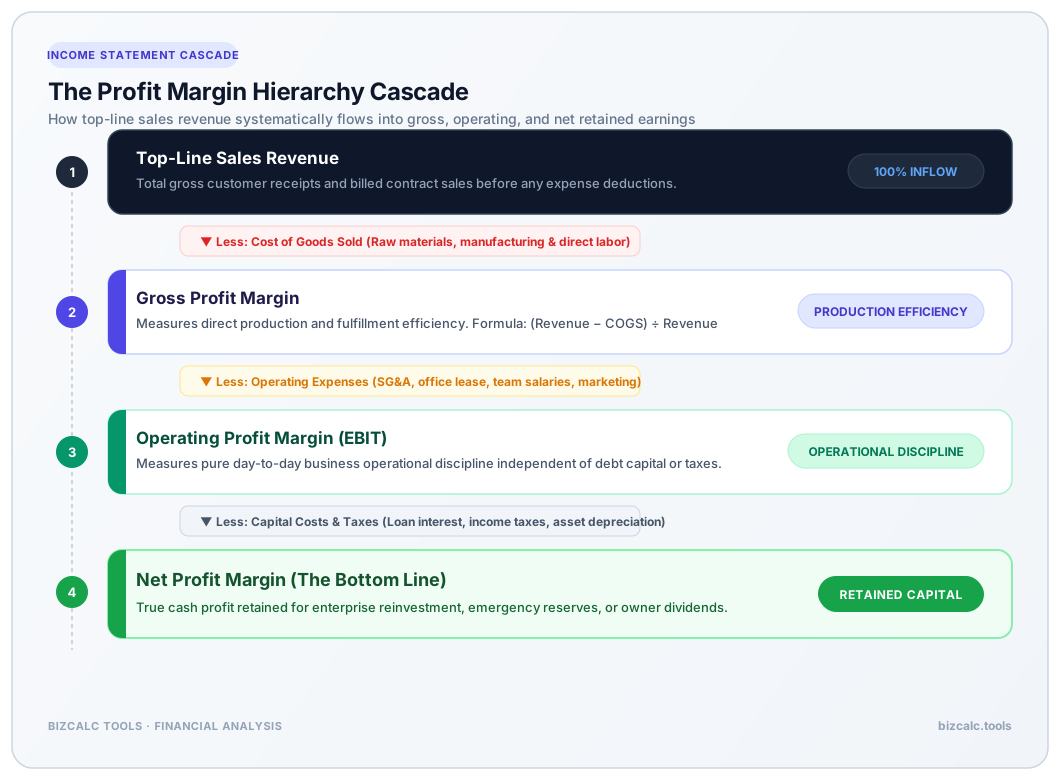
A business can boast strong liquidity today, but without disciplined profit margins, capital reserves will eventually drain away. Profitability ratios analyze how efficiently sales revenue converts into retained earnings across each tier of your income statement.
4. Gross Profit Margin
Gross Profit Margin measures the percentage of revenue remaining after subtracting direct Cost of Goods Sold (COGS)—materials, wholesale goods purchases, and direct labor directly tied to production or service delivery.
Gross Profit Margin (%) = [(Total Revenue − Cost of Goods Sold) ÷ Total Revenue] × 100
Practical Worked Example
A boutique furniture workshop generates $240,000 in quarterly revenue. Direct hardwood lumber, hardware components, and workshop carpenter wages total $132,000.
If your gross margin is thin (e.g., 15%), you must generate massive sales volumes just to cover basic fixed overhead like administrative salaries, workshop leases, and insurance. Furthermore, a sudden 5% rise in supplier lumber costs can erase a third of your profit. Tracking gross margin via our Gross Profit Calculator informs whether you need to adjust price points with the Pricing Strategy Calculator or renegotiate supplier supply contracts.
5. Net Profit Margin
Net Profit Margin represents the ultimate bottom-line health indicator. It reveals how much net profit remains from every dollar, pound, or euro of top-line revenue after satisfying all business expenses—including COGS, operating overhead, marketing, executive salaries, depreciation, loan interest, and business income taxes.
Net Profit Margin (%) = (Net Income ÷ Total Revenue) × 100
Practical Worked Example
Taking the furniture company generating $240,000 quarterly revenue:
For every $100 in furniture sold, the business retains $10.42 in pure profit available for distribution or retained business reserves. Track and benchmark your bottom line with our Profit Margin Calculator.
6. Operating Expense Ratio (OER)
The Operating Expense Ratio evaluates the proportion of revenue absorbed by operational overhead (non-production costs such as sales, marketing, administrative salaries, professional fees, insurance, and rent).
Small businesses frequently suffer from "lifestyle creep" in overhead. As revenue grows by 20%, administrative software licenses, travel expenses, and office perks expand by 40%. Monitoring OER ensures operating leverage works in your favor: as revenue scales, OER should decline or remain steady. Analyze your cost structure using our Operating Expense Ratio Calculator.
💼
Working Capital Calculator
Quantify your exact net working capital cushion to ensure your business can fund operational expenses and supplier payments.
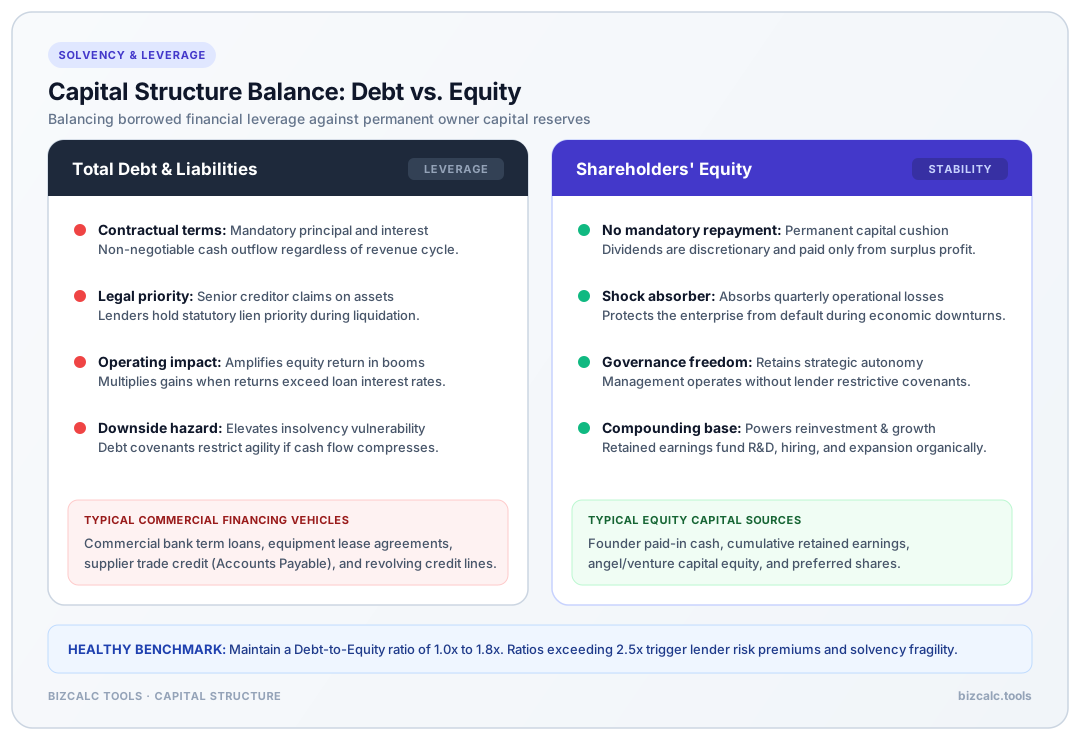
While liquidity ratios measure your ability to survive the next twelve months, solvency ratios evaluate your ability to survive the next five to ten years. Solvency examines your capital structure—specifically the balance between debt financing and equity capitalization.
7. Debt-to-Equity (D/E) Ratio
The Debt-to-Equity Ratio compares a company's total liabilities against its total shareholders' equity. It indicates how much external leverage the business utilizes to finance its assets relative to capital provided by owners and retained earnings.
Debt-to-Equity Ratio = Total Liabilities ÷ Total Shareholders' Equity
Practical Worked Example
A regional logistics and courier service has the following balance sheet values:
Total Liabilities (Vehicle Leases, Bank Loans, Supplier Payables): $180,000
Total Shareholders' Equity (Owner Capital + Cumulative Retained Profits): $120,000
Debt-to-Equity Ratio = $180,000 ÷ $120,000 = 1.5x
Interpreting Leverage Benchmarks
Below 1.0x: Highly conservative capital structure. The business funds most assets through retained profits and equity. While extremely resilient during recessions, the enterprise may be growing slower than competitors by underutilizing prudent growth financing.
1.0x to 2.0x: Prudent commercial balance for capital-intensive small businesses (e.g., manufacturing, transport, contracting).
Above 2.5x – 3.0x: Over-leveraged. The company is vulnerable to interest rate hikes and cash flow shocks. Lenders will hesitate to approve new credit lines without personal guarantees or collateral pledges.
8. Interest Coverage Ratio (Times Interest Earned)
The Interest Coverage Ratio measures how easily a business can pay interest due on outstanding debt out of its operating earnings before interest and taxes (EBIT).
Interest Coverage Ratio = Operating Income (EBIT) ÷ Annual Interest Expense
Practical Worked Example
A commercial bakery reports:
Operating Income (EBIT): $75,000 / year
Total Annual Interest Expense on Commercial Loans: $15,000 / year
Interest Coverage Ratio = $75,000 ÷ $15,000 = 5.0x
The bakery generates five times more operating income than required to service its debt interest.
Why Interest Coverage Matters in Changing Economic Cycles
Below 1.5x: Critical distress territory. A minor 10% drop in revenue or an interest rate hike on variable-rate debt could leave the company unable to service interest payments, triggering technical default.
2.5x to 3.5x: Acceptable minimum for most bank loan covenants.
Profit figures show how much cash you kept; efficiency and return ratios show how hard your assets and invested capital worked to generate those profits. These ratios answer the core investor question: Is this business generating a satisfactory return on the resources entrusted to it?
9. Return on Assets (ROA)
Return on Assets measures how efficiently management uses all company assets (machinery, vehicles, inventory, software, accounts receivable, and cash) to produce net earnings.
Return on Assets (%) = (Net Income ÷ Total Assets) × 100
Practical Worked Example
A commercial precision tool manufacturer owns $500,000 in total assets (machinery, facility improvements, working capital). Over the fiscal year, the business produces $45,000 in net income.
Asset-Heavy Sectors (Manufacturing, Transportation, Construction): Ratios of 6% to 10% represent solid performance due to large physical capital requirements.
Asset-Light Sectors (Consulting, Software, Professional Agencies): Frequently achieve ROA figures of 15% to 30%+ because they require little physical equipment to deliver services.
Return on Equity measures the rate of return earned on the net capital invested by shareholders and founders. It tells owners whether the business provides an attractive financial return compared to passive alternative investments (such as index funds, commercial real estate, or government bonds).
Return on Equity (%) = (Net Income ÷ Total Shareholders' Equity) × 100
An 18.75% ROE demonstrates strong capital stewardship. If the founder invested $240,000 into a passive portfolio yielding 8%, the capital would earn $19,200 annually. By operating this enterprise, the equity generates $45,000—delivering a substantial entrepreneurial risk premium. Evaluate your returns with our Return on Equity Calculator and compare capital investments via the ROI Calculator.
Bonus Metric: Inventory Turnover Ratio
For small businesses holding physical merchandise or raw materials, inventory velocity directly controls liquidity and profitability. The Inventory Turnover Ratio measures how many times inventory is sold and replaced over a year.
Inventory Turnover Ratio = Cost of Goods Sold ÷ Average Inventory
A turnover ratio of 6.0x means inventory cycles through every 60 days (365 ÷ 6). A low turnover ratio (e.g., 1.5x) indicates capital trapped in dusty warehouse stock, increasing the risk of spoilage, obsolescence, and storage overhead. Model your stock velocity using our Inventory Turnover Calculator.
The DuPont Analysis: Deconstructing What Really Drives ROE
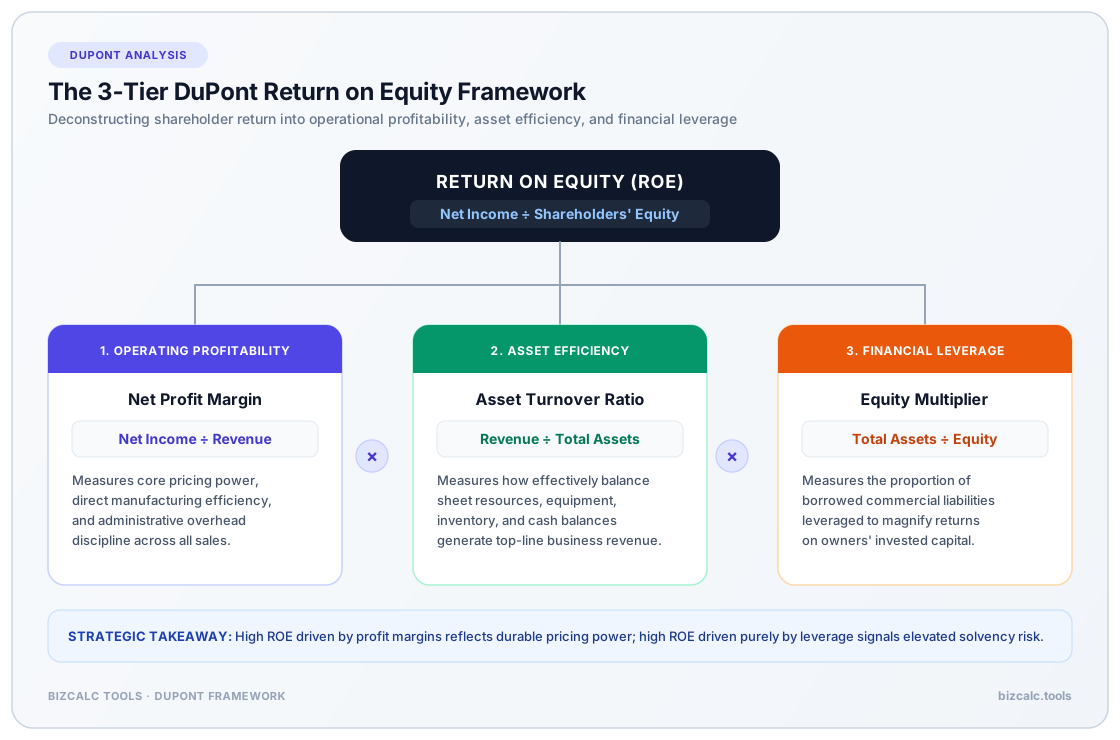
To understand why your Return on Equity is rising or falling, sophisticated financial analysts use the DuPont Framework. Developed by the DuPont Corporation, this methodology decomposes ROE into three multiplicative components:
When you multiply these three ratios together, Revenue and Assets cancel out, leaving Net Income ÷ Equity:
Net Profit Margin (Profitability): How much profit do you retain from each dollar of sales?
Asset Turnover (Efficiency): How many dollars of sales do you generate for each dollar of assets owned?
Financial Leverage (Equity Multiplier): How much debt do you use to amplify your asset base?
Why DuPont Analysis Protects Founders
A company can artificially inflate its ROE simply by taking on dangerous amounts of debt (high financial leverage). By breaking down ROE, you can immediately identify whether your attractive 22% return stems from high operational margins, superior asset velocity, or excessive financial risk.
Comprehensive Master Case Study: Diagnosing "Meridian Specialty Goods"
To see how these ten financial ratios interact in a real-world commercial context, consider the complete annual financial statements of Meridian Specialty Goods, a growing wholesale distributor.
Solid: Quick assets exceed liabilities by 44% without touching inventory.
3. Working Capital
$226,000 − $90,000 = +$136,000
Positive (>0)
Excellent: Abundant operational cushion to support volume spikes.
4. Gross Margin
($272,000 ÷ $680,000) × 100 = 40.0%
35% – 50%
Competitive: Healthy pricing power across wholesale product line.
5. Net Margin
($54,400 ÷ $680,000) × 100 = 8.0%
6% – 12%
Solid: Retains 8 cents on every dollar after all taxes and interest.
6. Operating Expense Ratio
($190,400 ÷ $680,000) × 100 = 28.0%
25% – 35%
Disciplined: Fixed overhead is tightly controlled relative to revenue.
7. Debt-to-Equity
$200,000 ÷ $140,000 = 1.43x
1.0x – 2.0x
Prudent: Conservative leverage; well within commercial banking standards.
8. Interest Coverage
$81,600 ÷ $13,600 = 6.0x
3.0x – 5.0x+
Safe: Operating income covers loan interest payments six times over.
9. Return on Assets
($54,400 ÷ $340,000) × 100 = 16.0%
8% – 12%+
Exceptional: Generates superior earnings relative to asset base.
10. Return on Equity
($54,400 ÷ $140,000) × 100 = 38.86%
15% – 25%+
Outstanding: Founders earn nearly 39% annual return on net equity.
Strategic Takeaways for Meridian's Leadership
Meridian represents an exceptionally well-run enterprise. Its 2.51x Current Ratio and $136,000 in net working capital ensure robust resilience against economic shocks. However, management should examine whether holding $90,000 in inventory is optimal; if inventory turnover can be accelerated from 4.5x to 6.0x, approximately $22,500 in idle cash could be freed to retire high-interest short-term debt or expand wholesale distribution channels.
Industry Benchmarks: How Target Ratios Differ by Commercial Sector
Financial ratios do not exist in a vacuum. A Current Ratio or Gross Margin that spells disaster for a software consultancy might represent peak performance for an e-commerce grocery distributor.
The table below details typical healthy ratio ranges across five major commercial industries:
Sector
Current Ratio
Gross Profit Margin
Debt-to-Equity (D/E)
Return on Assets (ROA)
Retail & E-Commerce
1.2x – 1.8x
35% – 55%
1.5x – 2.5x
8% – 14%
Professional & B2B Services
1.8x – 3.0x
50% – 75%+
0.5x – 1.2x
15% – 30%+
Light Manufacturing & Fabrication
1.5x – 2.2x
30% – 45%
1.2x – 2.0x
6% – 10%
Construction, Trades & Contracting
1.3x – 1.9x
20% – 35%
1.0x – 1.8x
7% – 12%
Hospitality & Food Service
0.8x – 1.3x
60% – 72%
1.8x – 3.0x
5% – 9%
Contextualizing Sector Peculiarities
Hospitality & Restaurants: Often operate with a Current Ratio below 1.0x. This is acceptable because customers pay instantly via card or cash, while suppliers provide 30-day payment terms. Negative working capital functions as an interest-free operating loan from vendors.
B2B Professional Services: Carry minimal inventory and physical equipment, yielding high gross margins (60%+) and low debt levels, but require higher current ratios (2.0x+) to manage 60-day invoice payment delays from corporate clients.
Contracting & Construction: Must monitor the Quick Ratio carefully because raw building materials on job sites cannot be converted into cash to meet weekly Friday subcontractor payroll.
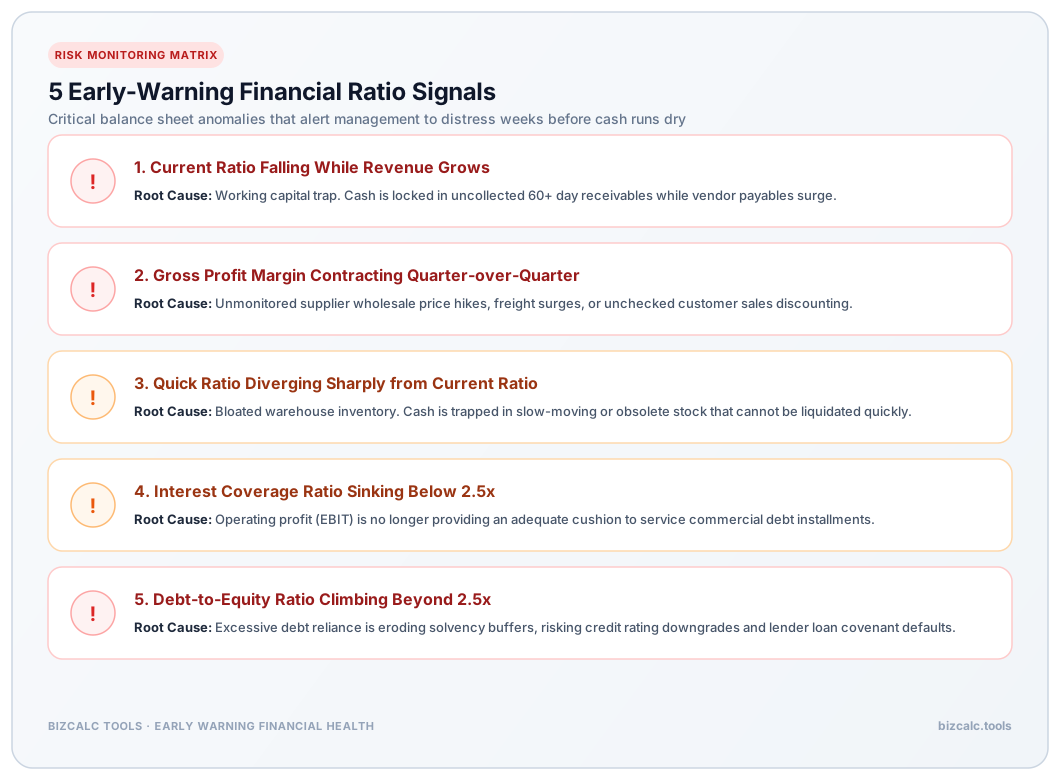
Five Warning Signs Revealed by Financial Ratios (and How to Fix Them)
Regular ratio tracking acts as an early warning system, alerting management to balance sheet vulnerabilities months before they appear as cash emergencies.
1. Divergence Between Current Ratio and Quick Ratio
The Symptom: Your Current Ratio looks stable at 2.2x, but your Quick Ratio has dropped to 0.7x.
The Root Cause: Your balance sheet is accumulating excess inventory. Cash is leaving the business to purchase raw materials or finished goods that are sitting unsold on warehouse shelves.
The Remedy: Pause bulk purchasing, run inventory clearance promotions, and utilize our Break-Even Calculator to determine optimal floor pricing for obsolete stock.
2. The "Profitable Growth" Working Capital Trap
The Symptom: Sales revenue grew by 40%, but your Net Working Capital and bank balances are depleted.
The Root Cause: Rapid growth consumes cash. Delivering larger orders requires buying inventory upfront and waiting 60 days for clients to pay invoices.
The Remedy: Shorten customer payment terms from net-60 to net-30, offer small early-payment invoice discounts, or implement milestone progress billing on large contracts.
3. Gradual Gross Margin Erosion
The Symptom: Gross margin declines from 48% to 41% over three consecutive quarters.
The Root Cause: Input cost inflation has occurred without corresponding customer price adjustments, or sales staff are offering excessive discretionary discounts to close deals.
The Remedy: Implement price increases, audit component costs with suppliers, and establish a firm discount approval matrix for your sales team.
4. Interest Coverage Compression
The Symptom: Interest coverage drops below 2.5x during an economic slowdown.
The Root Cause: Fixed interest commitments consume too much of your compressed operating earnings.
The Remedy: Prioritize paying down high-interest floating debt, renegotiate commercial loan terms, or refinance short-term debt into longer-term fixed instruments.
5. Hidden Leverage Expansion
The Symptom: Debt-to-Equity climbs above 2.5x as operating losses erode retained earnings.
The Root Cause: The business is relying on debt facilities to fund daily operating losses rather than capital investments.
The Remedy: Cut non-essential operating overhead, improve collection velocity on receivables, and avoid taking on additional debt until equity recovers.
Practical Implementation: Building Your Monthly Financial Dashboard
Tracking financial ratios does not require expensive enterprise software. It requires a consistent monthly accounting routine.
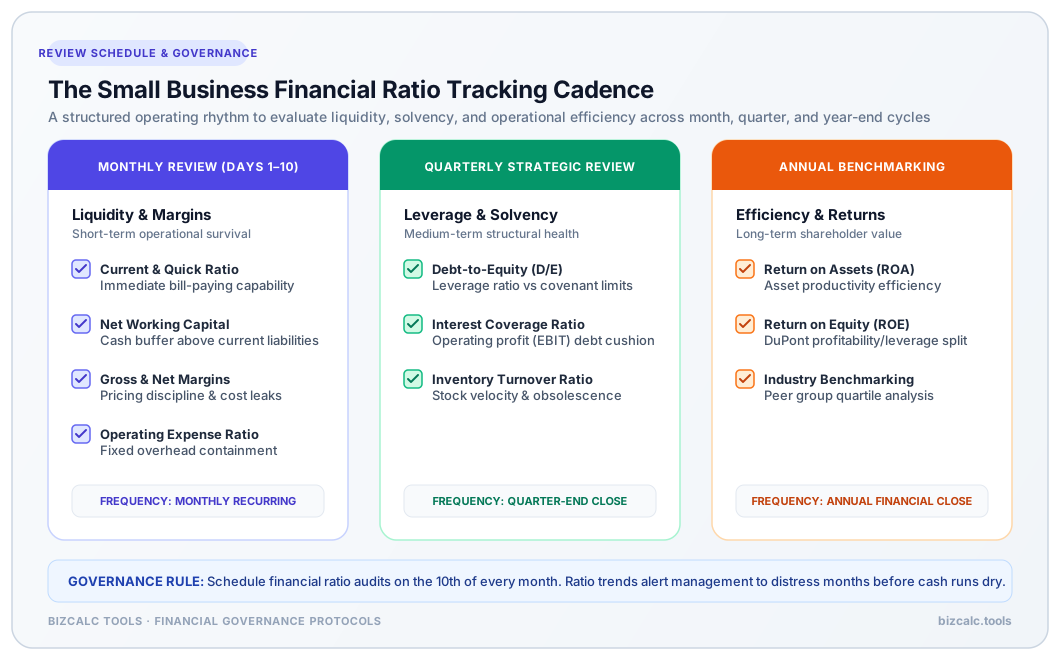
The Small Business Financial Ratio Tracking Cadence
Follow this structured review schedule:
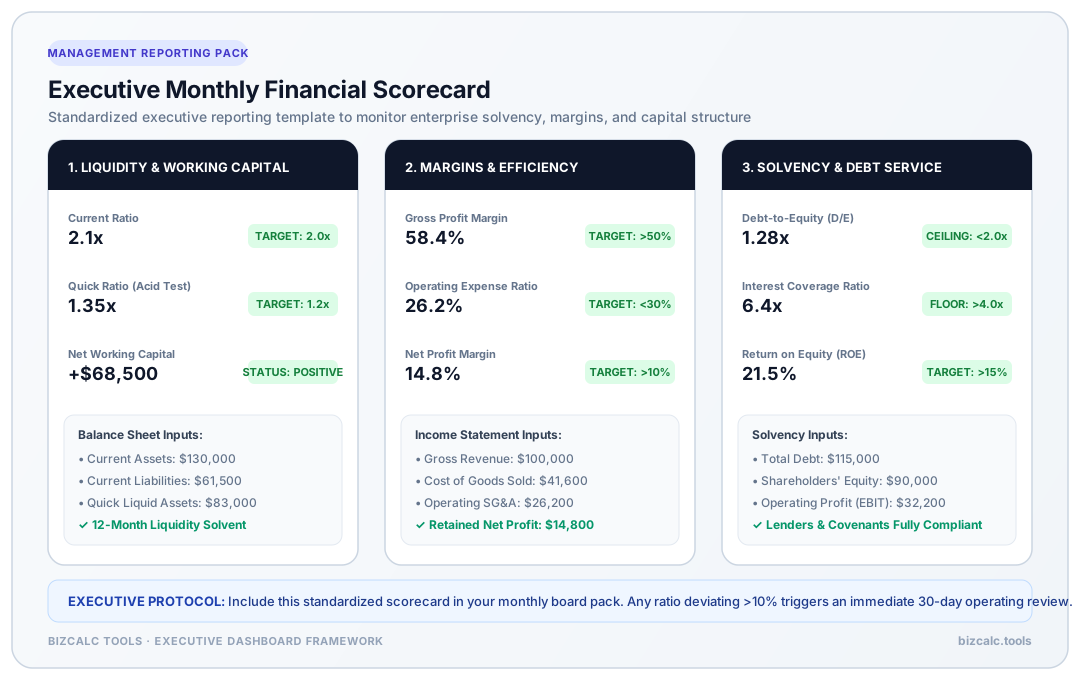
Executive Financial Dashboard Template
Incorporate the following standardized reporting framework into your monthly executive pack:
Conclusion: Transforming Data into Enterprise Value
Financial statements record history; financial ratios predict the future. By moving beyond simple bank account balances and tracking these ten core indicators, small business owners gain complete control over their commercial destiny.
Ratios remove emotion and guesswork from executive decisions. They show you exactly when you have the liquidity to hire, when your pricing model needs adjustment, and when your debt structure threatens enterprise stability. When evaluated consistently month after month, financial ratios transform routine bookkeeping into a powerful engine for compounding sustainable wealth.
📈
Return on Equity Calculator
Measure the true earning power of your invested capital and evaluate how efficiently your equity compounds over time.
Financial ratios are quantitative indicators calculated from a company's financial statements that measure liquidity, operational efficiency, profitability, and solvency. They allow business owners to track performance trends, benchmark against industry peers, and spot emerging financial vulnerabilities early.
Which financial ratio is most critical for day-to-day business survival?
The Current Ratio and Net Working Capital are the most critical for immediate operational survival because they evaluate whether an enterprise holds sufficient short-term liquid assets to satisfy upcoming liabilities over the next twelve months.
How often should small business owners calculate and review financial ratios?
Liquidity and working capital ratios should be reviewed monthly alongside management accounts, while profitability, efficiency, and solvency metrics like ROE, ROA, and Debt-to-Equity are typically analyzed quarterly and annually.
What is the key difference between liquidity ratios and solvency ratios?
Liquidity ratios (like the Current Ratio) evaluate a firm's ability to satisfy short-term financial obligations due within one operating year, whereas solvency ratios (like Debt-to-Equity) assess long-term viability and the ability to sustain debt service over multi-year cycles.
Can a business show healthy profit margins while suffering from dangerous financial ratios?
Yes. An enterprise can report high gross or net profit margins while suffering from severe liquidity bottlenecks if capital is locked up in slow-moving inventory or uncollected accounts receivable, leading to a depleted Current Ratio and negative working capital.
#financial ratios small business#current ratio#debt to equity#return on equity#small business finance