The Hidden Price Tag: Understanding Employee Turnover Costs
Losing an employee costs much more than just their salary. Discover the hard and soft costs of employee turnover, how to calculate the real financial impact, and proven retention strategies.
BT
Bizcalc Team
·March 18, 2025
Every manager knows the sinking feeling of a resignation letter landing on their desk. The immediate reaction is operational — who covers the work, how quickly can we hire, what do we tell the team? But beneath the logistical panic lies a financial reality that most businesses systematically underestimate: the true cost of employee turnover is enormous, largely invisible on the income statement, and almost certainly higher than any salary increase or retention bonus it would have taken to prevent it.
The Society for Human Resource Management (SHRM) estimates that replacing an employee costs between 50% and 200% of their annual salary, depending on their seniority and specialisation. For a mid-level professional earning $50,000, that is a $25,000 to $100,000 hit to the business — most of it never appearing as a single line item on any report.
This guide breaks down exactly where those costs come from, how to quantify them, what your organisation's turnover rate means for your bottom line, and the evidence-based retention strategies that deliver the best return on investment.
Table of Contents
Why Employee Turnover Costs Are Systematically Underestimated
The reason turnover costs are so consistently underestimated is structural: they are distributed across multiple departments, budget lines, and time periods, and most of them appear as indirect costs rather than direct cash outflows.
When a finance team calculates the cost of losing an employee, they typically count the recruiter fee or the job board spend. This captures perhaps 20–30% of the true cost. The remaining 70–80% sits in productivity losses, manager time, onboarding drag, institutional knowledge destruction, and team morale impacts — none of which appear as a discrete invoice.
The result is a systematic undervaluation of retention. When leaders compare the cost of a 10% salary increase to "the cost of hiring a replacement," they are almost always comparing against an incomplete cost figure — and concluding, incorrectly, that it is cheaper to let the employee leave.
The Full Cost of Employee Turnover: A Complete Breakdown
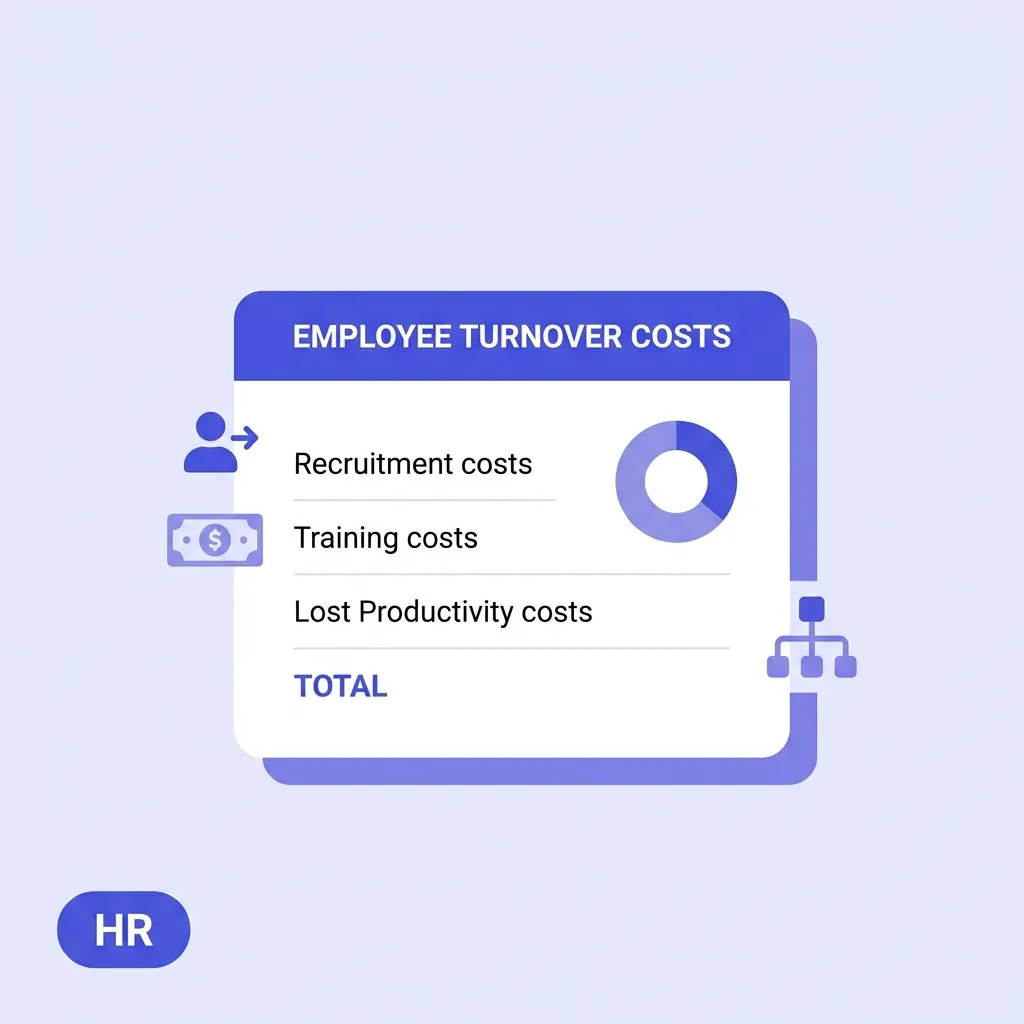
The total cost of replacing an employee falls into four main categories: separation costs, recruiting and hiring costs, onboarding and training costs, and productivity loss costs. Each category contains both hard costs (direct cash expenditure) and soft costs (time and resource costs that represent real economic value but do not appear as explicit invoices).
Category 1: Separation Costs
These are the costs incurred from the moment an employee gives notice to the moment they leave.
Exit interview administration — HR time planning, conducting, and documenting exit interviews. Even a one-hour process for a skilled HR professional represents a meaningful time cost when aggregated across all turnover events.
Final payroll processing — calculating and processing unused holiday pay, notice period pay, commission settlements, PAYE adjustments, and pension contributions.
Offboarding administration — deactivating system access, collecting company property, updating client-facing materials, notifying relevant internal and external stakeholders.
Handover management — the departing employee's time (often their most valuable remaining contribution, ironically) spent documenting processes, briefing colleagues, and transferring responsibilities. In practice, this handover is almost always incomplete.
Legal and compliance — reviewing any non-compete, confidentiality, or non-solicitation agreements; any settlement or severance arrangements (for involuntary departures); employment law compliance review.
For a mid-level employee, separation costs alone — even excluding any severance — typically total $1,500 to $4,000 in direct and indirect costs.
Category 2: Recruiting and Hiring Costs
The hard costs of finding and attracting a replacement are the most visible component of turnover cost, but they still tend to be underestimated.
Job board advertising — LinkedIn job posts, Indeed promoted listings, specialist sector boards. A single actively promoted LinkedIn job post can cost $500–$1,500 per month. Most roles require 4–8 weeks of active advertising.
Recruiter and agency fees — external recruitment agencies typically charge 15–25% of the first year's salary. For a $50,000 role, this is $7,500–$12,500. Even if a role is filled without an agency, the internal recruiter's time spending 20–40 hours on sourcing, screening, and coordinating represents significant cost.
Employer branding and position marketing — any sponsored content, events, or campus recruitment activities specifically undertaken to attract candidates.
Interview process time — this is the largest soft cost in the recruiting phase. Consider a typical interview process:
Interview stage
Participants
Time per participant
CV screening and phone screen
HR recruiter
2–4 hours per shortlist
First interview
HR + hiring manager
1 hour per candidate × 5 candidates
Second interview (technical/skills)
Hiring manager + 2 team members
1.5 hours × 3 candidates
Final interview
Senior leader + HR
1 hour × 2 candidates
Debrief and decision
All panel members
1–2 hours
For a $50,000 role, this process typically consumes 40–80 hours of combined internal time. At fully loaded employment costs of $35–$60 per hour for the professionals involved, the interview process costs $1,400–$4,800 in opportunity cost alone — before a single offer is made.
Sign-on bonuses and relocation — competitive markets increasingly require financial incentives to secure the preferred candidate, particularly for technical, specialist, or senior roles.
Total recruiting costs for a mid-level professional: typically $8,000–$20,000 depending on seniority, market competitiveness, and whether an agency is used.
Category 3: Onboarding and Training Costs
Onboarding costs are perhaps the most consistently underestimated component of total turnover cost.
Formal induction and training — structured training programmes, e-learning licences, access to internal learning management systems, any external courses or certifications required for the role.
Equipment and setup — laptop provisioning, software licences, access card setup, desk and ergonomics setup, uniform or PPE if applicable. These costs are not incremental (the company already had these) only if the equipment was not refreshed — in many organisations, a new starter triggers new equipment procurement.
Manager onboarding time — research consistently shows that a new hire's direct manager spends 25–40% of their working time on onboarding activities during the first month alone. For a manager earning $60,000 per year, one month of 30% time allocation costs approximately $1,500 in manager capacity.
Buddy/mentor programme costs — if the organisation pairs new starters with experienced employees, those experienced employees are not performing their normal role at full capacity during the pairing period.
Compliance and regulatory training — health and safety, data protection, information security, industry-specific regulatory requirements. These are mandatory cost floors that apply regardless of other onboarding investment.
Administrative overhead — payroll setup, pension enrolment, benefits administration, system access provisioning across multiple platforms.
Total onboarding costs for a mid-level professional: typically $3,000–$8,000 in direct costs, plus significant soft costs.
Category 4: Productivity Loss Costs
This is the largest, least visible, and most consequential component of employee turnover costs. It operates across three distinct phases:
Phase 1: The Departure Gap
When an employee gives notice, their effective productivity begins declining immediately — not necessarily from lack of effort, but from the natural shift in priorities. They are focused on wrapping up, handing over, and mentally transitioning. Research suggests departing employees operate at roughly 60–70% of normal productive capacity during their notice period.
Additionally, the team around the departing employee experiences disruption. Client relationships may need to be transferred. Team members take on additional responsibilities. Meeting and project cadences change.
Phase 2: The Vacancy Period
Between the departure and the new hire's first day, the role is unfilled. Work must either stop, be redistributed to existing team members (increasing their workload), or be covered by temporary contractors (adding direct cost). This period averages 4–12 weeks for most professional roles, and up to 24 weeks for senior leadership positions.
Phase 3: The Ramp-Up Period
A new hire almost never operates at full productivity from day one. Research from the Aberdeen Group and other HR analytics firms consistently finds:
Time in role
Typical productivity level
Month 1
25% of expected output
Month 2
45% of expected output
Month 3
65% of expected output
Month 4–6
75–90% of expected output
Month 6–12
90–100% of expected output
For a role generating $4,000/month of value, this ramp-up curve represents approximately $15,000–$20,000 of foregone productivity over the first six months of the new hire's employment — in addition to their full salary being paid throughout.
⚡
Productivity Loss Calculator
Quantify the output gap during ramp-up for specific roles in your organisation to understand the true cost of lost productivity.
The Total Employee Turnover Cost: A Worked Example
Let us calculate the full cost of replacing a mid-level marketing manager earning $55,000 per year.
Cost Category
Estimated Cost
Separation administration
$2,000
Exit processing (HR time, legal review)
$1,500
Recruiter agency fee (20% of salary)
$11,000
Job board advertising (6 weeks)
$1,800
Interview process (60 hrs × $40/hr fully loaded)
$2,400
Equipment and software setup
$1,500
Onboarding training and materials
$2,500
Manager onboarding time (4 weeks × 30%)
$3,175
Team productivity impact (2 months coverage disruption)
$4,000
New hire ramp-up productivity loss (6 months)
$14,000
Total Estimated Turnover Cost
$43,875
That is 80% of this employee's annual salary — a single turnover event that will never appear as a single budget line but represents a very real business cost.
Now multiply this by your average annual number of departures. If your 100-person company has a 15% annual turnover rate (15 departures), and average employee salary is $45,000, your annual turnover cost could be:
15 departures × $36,000 average cost = $540,000 per year
This is the number most organisations have never calculated.
🚪
Employee Turnover Calculator
Apply this framework to your own headcount data. Calculate your current turnover rate and estimate its annual financial impact.
Before you can model the financial impact, you need to know your turnover rate:
Turnover Rate (%) = (Number of Separations ÷ Average Headcount) × 100
Where:
Number of Separations = employees who left during the period (voluntary and involuntary combined, or calculated separately)
Average Headcount = (headcount at start of period + headcount at end of period) ÷ 2
Example
If your business started the year with 80 employees and ended with 90, and 12 employees left during the year:
Average headcount = (80 + 90) ÷ 2 = 85
Turnover rate = (12 ÷ 85) × 100 = 14.1%
Voluntary vs Involuntary Turnover
Calculate these separately — they have very different causes, costs, and intervention strategies:
Voluntary turnover (resignations, retirements) reveals dissatisfaction with compensation, management, culture, or career growth. This is the category most amenable to retention interventions.
Involuntary turnover (dismissals, redundancies) reflects hiring quality, performance management effectiveness, and business restructuring decisions.
High voluntary turnover is the leading indicator of cultural or compensation problems. High involuntary turnover may indicate hiring process failures or inadequate performance management.
Turnover Rate Benchmarks by Industry
Industry
Average Annual Turnover Rate
Hospitality and food service
70–100%
Retail
55–75%
Healthcare
20–30%
Financial services
15–20%
Technology
13–18%
Professional services
12–18%
Manufacturing
15–22%
Education
10–15%
Government/public sector
5–10%
Comparing your turnover rate against industry benchmarks contextualises whether your rate reflects a systemic problem or an expected feature of your sector's labour market. High-turnover industries like hospitality structurally factor turnover into their business models; lower-turnover professional services or technology firms treating high turnover as inevitable are likely leaving significant value on the table.
The Full Cost of Employee Turnover by Seniority
Turnover costs scale significantly with seniority. Entry-level roles are faster to fill and less expensive to replace than senior or specialised roles, but they still carry meaningful costs.
Role Level
Typical Turnover Cost as % of Salary
Example ($40K salary)
Entry-level / junior
30–50%
$12,000–$20,000
Mid-level professional
70–120%
$28,000–$48,000
Senior / specialist
100–150%
$40,000–$60,000
Manager / team lead
150–200%
$60,000–$80,000
Director / VP
200–300%+
$80,000–$120,000+
C-Suite / Executive
300–500%+
$120,000–$200,000+
Executive turnover in particular carries extraordinary costs: lengthy search processes, significant agency or executive search fees, long vacancy periods while a successor is identified, and extended ramp-up times — often 12–18 months before a new executive is operating at full effectiveness.
Why Employees Leave — The Real Drivers of Voluntary Turnover
Understanding the root causes of voluntary turnover is essential for designing effective interventions. Gallup's extensive research on employee engagement identifies the consistently dominant drivers of voluntary departures:
Compensation misalignment — employees who believe they are underpaid relative to market benchmarks are significantly more likely to leave. Importantly, the threshold for this is lower than most managers assume: feeling underpaid by even 5–10% is sufficient to trigger active job searching.
Poor management quality — the adage "people don't leave companies, they leave managers" is supported by strong data. Gallup finds that 50% of employees who quit cite their manager as the primary reason. Management quality is the single most controllable variable in voluntary turnover.
Lack of career development and growth — particularly for high-performing employees in the 25–40 age bracket, the absence of clear progression paths, stretch assignments, or skills development opportunities drives departure — often to competitors who explicitly offer development frameworks.
Cultural and values misalignment — employees who do not feel they belong, do not believe in the company's mission, or experience values conflicts with leadership will disengage and eventually leave.
Work-life balance and flexibility — the post-pandemic recalibration of work norms has permanently elevated flexibility expectations. Organisations that mandated full-time office attendance without strong cultural or community justification saw elevated voluntary turnover in 2022–2024.
6 Proven Strategies to Reduce Employee Turnover
1. Conduct Exit Interviews — and Actually Use the Data
Exit interviews are standard practice in most organisations; acting on their findings is far less common. Systematically track and categorise exit interview data by department, manager, role type, and tenure. The patterns that emerge will almost always reveal specific, addressable causes — particular managers with high turnover under them, compensation gaps in certain role families, career path dead ends in specific departments.
2. Invest in Pay-to-Market Benchmarking
Conduct annual compensation benchmarking against your specific market (role type, geography, company size, industry). This does not require external consultants — salary aggregator data from LinkedIn Salary, Glassdoor, and sector-specific surveys is increasingly accessible and accurate. Identify roles where your pay is below the 50th percentile and prioritise correction.
👥
Employee Cost Calculator
Model the total cost of compensation adjustments versus the turnover cost of letting market gaps persist.
Work with managers to define explicit progression frameworks for each role family: what does it take to move from junior to mid-level, from mid-level to senior, from senior to lead? Make these frameworks visible to employees and use them as the basis for structured development conversations at least quarterly. Employees who can see a credible path forward are dramatically less likely to look externally for progression.
4. Train Managers on Retention Behaviours
Since management quality is the primary driver of voluntary turnover, investing in management capability delivers the highest ROI of any retention intervention. Focus training on: how to conduct high-quality 1:1s, how to give and receive feedback, how to recognise contributions meaningfully, how to support career development, and how to identify early warning signs of disengagement.
5. Implement Stay Interviews
Rather than waiting for exit interviews — which capture only post-decision information — conduct regular "stay interviews" with high-performing employees. Ask directly: what is keeping you here? What would make you consider leaving? What could the company do to make your role more fulfilling? This surfaces actionable intelligence before an employee has begun a job search, when intervention is still possible.
6. Act on Engagement Survey Findings — Visibly
Employee engagement surveys are valuable only if employees see that their input leads to change. The single greatest driver of engagement survey disengagement is the perception that nothing changes as a result. When survey findings surface significant themes, communicate specifically what actions are being taken in response, who is accountable, and by when.
Retention ROI: Why Paying to Keep Employees Is Always Cheaper
The retention ROI calculation is straightforward: compare the cost of a retention intervention against the probability-adjusted cost of turnover if the employee leaves.
Example:
A high-performing software engineer earning $70,000 is considering leaving for a role at $80,000. The cost to give them a counter-offer matching the market rate is $10,000 per year in additional salary cost.
Probability of leaving without intervention: ~75%
Expected turnover cost if they leave: assume 150% of salary = $105,000
Risk-adjusted cost of not acting: 75% × $105,000 = $78,750
Cost of retention intervention: $10,000/year
Even discounting the retention benefit over just two years ($20,000 additional salary cost), the expected benefit of the retention intervention is $78,750 − $20,000 = $58,750 in avoided turnover cost — not accounting for the continued productivity, institutional knowledge, and team stability value the retained employee provides.
This calculation is almost always compelling. The reason retention interventions are underused is not that they fail economically — it is that the counterfactual cost of turnover is not visible to the decision-maker at the moment of choice.
Frequently Asked Questions
How much does it cost to replace an employee?
Estimates vary by source and methodology, but the most widely cited range from SHRM is 50–200% of the departing employee's annual salary. The variance reflects seniority: entry-level roles are at the lower end, specialised professional and management roles at the higher end, and executive roles can exceed 300% of salary due to extended search timelines and significant productivity impacts.
What is a healthy employee turnover rate?
There is no universal "healthy" rate — it is industry-dependent. For professional services, technology, and financial services, rates below 10–15% are generally considered healthy. For retail and hospitality, rates of 30–60% may reflect normal sector dynamics but still represent significant avoidable cost. Within any business, a declining voluntary turnover trend over time is the most meaningful positive signal.
Is some turnover actually good for a business?
Yes — some turnover is healthy. Involuntary separation of genuinely poor performers improves team quality and creates space for stronger talent. Voluntary turnover that brings fresh perspectives, skills, and ideas into a team can be reinvigorating. Most HR practitioners target a "regrettable turnover" metric — departures of employees the business would have preferred to retain — as more meaningful than overall turnover rate. The goal is not zero turnover, but minimal regrettable turnover.
What is the difference between turnover rate and attrition rate?
These terms are sometimes used interchangeably, but technically: turnover rate refers to all separations (voluntary and involuntary) over a period; attrition rate sometimes refers specifically to positions that are not refilled after an employee leaves — i.e., headcount reduction. In most practical HR contexts, they are treated as equivalent.
How do I calculate the cost of turnover for my organisation?
Use the framework in this article to estimate costs across four categories: separation, recruiting and hiring, onboarding and training, and productivity loss. Input your average salary, recruitment method, and onboarding timeline.
🚪
Employee Turnover Calculator
Calculate your turnover rate and the total financial cost of employee departures.
Why is productivity loss the biggest component of turnover cost?
Because the ramp-up period for a new hire is long (typically 3–12 months to full productivity depending on role complexity), and the opportunity cost of reduced output during that period accumulates silently. A role generating $5,000/month of value operating at 50% effectiveness for 6 months represents $15,000 of foregone value — significantly exceeding most organisations' recruiter fees for the same role.
Start Measuring Turnover Cost in Your Organisation Today
The first step to reducing the cost of employee turnover is to make it visible. When leadership can see the true fully loaded cost of a departure — not just the recruiter fee, but the full $40,000–$80,000+ economic impact — retention investment decisions look very different.
🚪
Employee Turnover Calculator
Calculate your current turnover rate and estimate its annual financial impact.
Retention is not a "soft" HR initiative. It is one of the highest-ROI financial decisions available to any business. The maths is clear — the only question is whether you have made it visible enough to act on.
Frequently Asked Questions
What is the cost of employee turnover?
Turnover costs include the hard costs of recruiting and training a replacement, plus the soft costs of lost productivity, lower team morale, and potential loss of client relationships.
How much does it cost to replace an employee?
Studies show it generally costs between 33% and 50% of an entry-level employee's annual salary to replace them, and up to 200% for highly skilled executives.
What is the formula for turnover rate?
Divide the number of employees who left during a period by the average number of employees during that same period, then multiply by 100 to get the percentage.
What are the hidden costs of high turnover?
Hidden costs include the productivity gap while the position is vacant, the time management spends interviewing, and the slower output of the new hire as they ramp up.
How can a company reduce its turnover rate?
Companies can reduce turnover by offering competitive pay and benefits, providing clear career advancement paths, prioritizing a healthy work-life balance, and improving their hiring process.
#employee turnover costs#staff turnover#hr costs#employee retention#cost of turnover#hr management