The Ultimate Guide to Customer Acquisition Cost (CAC)
Learn how to calculate Customer Acquisition Cost (CAC), why it's the most critical metric for startup growth, and actionable strategies to lower it.
BT
Bizcalc Team
·March 14, 2025
Customer Acquisition Cost — almost universally abbreviated to CAC — is arguably the single most important growth metric for any business that spends money to bring in customers. It is the number that separates a scalable growth engine from an unsustainable cash burn machine.
Yet despite its importance, CAC is widely misunderstood, inconsistently calculated, and frequently misinterpreted. Many businesses track a version of CAC that excludes key cost categories — giving them a flattering but misleading picture of their acquisition efficiency. Others know their headline CAC but have no idea how to benchmark it, improve it, or relate it to the revenue each customer generates.
This guide covers everything: what customer acquisition cost is, how to calculate it correctly, what counts as a good CAC in different industries, how to interpret it in relation to customer lifetime value, and the most effective strategies for reducing it systematically.
🎯
CAC Calculator
Calculate your fully loaded Customer Acquisition Cost across all channels and periods. Know exactly what each new customer costs your business.
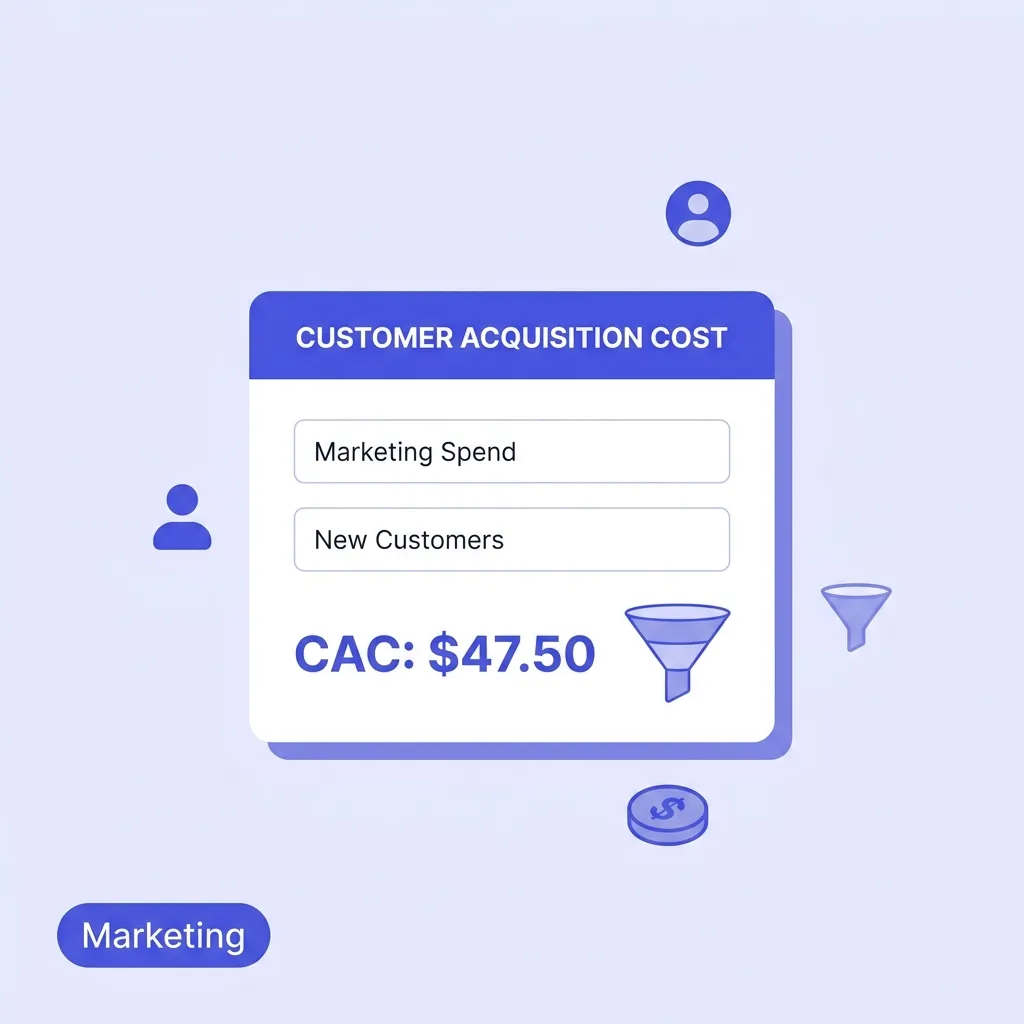
Customer Acquisition Cost is the total amount of money a business spends to acquire one new paying customer, on average, over a given period. It is calculated by dividing all sales and marketing expenditure during a period by the number of new customers acquired in the same period.
CAC = Total Sales & Marketing Costs ÷ Number of New Customers Acquired
The simplicity of the formula belies the complexity of getting it right. The most common error is underestimating the numerator — the total cost of acquisition — by excluding cost categories that feel indirect but meaningfully contribute to winning customers.
Basic vs Fully Loaded CAC
There are two versions of CAC that businesses commonly calculate:
Basic CAC includes only direct, variable marketing spend — typically paid advertising costs (Google Ads, Facebook Ads, LinkedIn, etc.). This is fast to calculate but systematically underestimates the true cost of acquiring a customer.
Fully loaded CAC includes every cost that contributes to customer acquisition, whether directly variable or fixed. This is the number that actually matters for business decision-making.
For most businesses, the gap between basic CAC and fully loaded CAC is 2–4× — meaning businesses that only track paid ad spend think their acquisition is two to four times cheaper than it actually is. This leads to over-investment in growth, underpricing, and subscription/unit economics that look profitable on paper but destroy value in practice.
How to Calculate Fully Loaded CAC
To calculate fully loaded CAC accurately, include all of the following in your total sales and marketing costs for the period:
Paid Advertising and Promotions
Spend on all paid channels: Google Ads, Meta (Facebook/Instagram), LinkedIn, TikTok, Twitter/X, programmatic display, podcast advertising, sponsorships
Affiliate and partner commissions paid to referrers for new customers
Influencer marketing fees
Paid PR placements
Software and Tools
CRM software (HubSpot, Salesforce, Pipedrive) — the proportion used for acquisition-focused activities
If this company only counted its paid advertising spend ($18,000 ÷ 38), it would report a misleading CAC of $474 — a 6.3× undercount. Business decisions made on the basis of a $474 CAC would be catastrophically wrong.
Use our CAC Calculator to run this calculation and track CAC across periods automatically.
What Is a Good Customer Acquisition Cost?
There is no universal "good CAC" — it is entirely relative to your business model, the value of each customer, and your industry. A $3,000 CAC might be an exceptional result for a B2B software company with $50,000 average contract values, and a catastrophic result for an ecommerce business selling $30 products.
Context is everything — which is why CAC must always be evaluated in relation to Customer Lifetime Value (LTV).
CAC by Industry
That said, typical CAC ranges by industry give useful directional benchmarks:
Industry
Typical CAC Range
SaaS (SMB)
$200 – $700
SaaS (Enterprise)
$3,000 – $50,000+
eCommerce
$15 – $90
Financial Services
$200 – $1,000
B2B Professional Services
$500 – $5,000
Mobile Apps
$1 – $4
EdTech
$50 – $300
Healthcare
$150 – $600
Real Estate
$1,500 – $5,000
These ranges are approximate and vary significantly based on target audience, geographic market, competitive intensity, and channel mix. Track your own CAC consistently over time and benchmark against your specific niche rather than broad industry averages.
The LTV:CAC Ratio — The Most Important Growth Metric
The LTV:CAC ratio is the metric that turns CAC from an isolated number into a powerful business health indicator. It answers the fundamental question: for every pound spent acquiring a customer, how many pounds of value does that customer generate over their relationship with the business?
LTV:CAC Ratio = Customer Lifetime Value ÷ Customer Acquisition Cost
What Is Customer Lifetime Value (LTV)?
Customer Lifetime Value is the total gross profit a business can expect to generate from a customer over the entire duration of their relationship. It combines average revenue per customer, gross margin, and customer retention:
LTV = (Average Revenue per Customer per Year × Gross Margin %) ÷ Annual Customer Churn Rate
Or for subscription businesses:
LTV = Average Monthly Revenue per Customer × Gross Margin % × Average Customer Lifetime (months)
Use our LTV Calculator to calculate this for your business.
Interpreting the LTV:CAC Ratio
The ratio is the lens through which investors, growth teams, and executive teams evaluate acquisition efficiency:
LTV:CAC Ratio
Interpretation
Below 1:1
Losing money on every customer acquired. Business model is fundamentally broken at current pricing/cost structure.
1:1 – 2:1
Marginal. Acquisition is barely covered by customer value. No room for operational costs or profit.
3:1
The widely cited benchmark for a healthy, scalable business — particularly in SaaS. Sustainable unit economics.
4:1 – 5:1
Strong. Good profitability per customer, healthy return on customer acquisition investment.
Above 5:1
Potentially under-investing in growth. The business could likely accelerate by spending more on acquisition without degrading returns.
LTV:CAC Example
Continuing with our B2B software company (CAC = $3,000):
Average annual contract value: $12,000
Gross margin: 75%
Average customer lifetime: 4 years
Annual churn rate: 25%
LTV = $12,000 × 75% ÷ 25% = $36,000
LTV:CAC Ratio = $36,000 ÷ $3,000 = 12:1
This is an exceptionally healthy ratio — the business generates $12 of lifetime gross profit for every $1 spent acquiring a customer. A ratio this high suggests the company could invest significantly more in acquisition and still maintain strong unit economics.
CAC Payback Period — How Fast Do You Recover Acquisition Costs?
LTV:CAC tells you the ultimate return. CAC Payback Period tells you how fast you get your money back — which matters enormously for cash flow.
CAC Payback Period = CAC ÷ (Average Monthly Revenue per Customer × Gross Margin %)
For our B2B software company:
CAC: $3,000
Average Monthly Revenue per Customer: $1,000 ($12,000 ÷ 12)
This means the company recovers its acquisition investment in 4 months, then generates gross profit for the remaining average 44 months of the customer relationship.
Benchmarks for CAC Payback Period
Business Type
Target Payback Period
SaaS (SMB)
12–18 months
SaaS (Enterprise)
18–24 months
eCommerce
3–6 months
Consumer Subscription
6–12 months
B2B Services
6–18 months
A payback period longer than 18–24 months creates meaningful cash flow pressure, especially for early-stage businesses. You are funding growth by lending money to customers without interest — and the gap must be covered by your own capital or external funding.
How Channel Mix Affects CAC
Not all acquisition channels have the same CAC — and the blended CAC you calculate across all channels obscures important channel-level efficiency data. Breaking CAC down by channel is one of the most valuable exercises in marketing analytics.
Channel CAC = Channel-Specific Costs ÷ New Customers Attributable to That Channel
Typical channel CAC hierarchy (from highest to lowest cost):
Channel
Relative CAC
Notes
Outbound sales (cold)
Very High
Expensive per contact, low conversion
Paid social (brand awareness)
High
Low intent, long journey
Paid search (non-brand)
Medium-High
High intent but competitive
Paid search (brand keywords)
Medium
Lower CPC, higher intent
Affiliate / Partner
Medium
Pay-per-acquisition model
Inbound content / SEO
Low
High upfront cost, near-zero marginal cost at scale
Referral / Word of mouth
Very Low
Acquired at marginal cost via social proof
Organic social
Very Low
Near zero marginal cost
The business case for investing in content marketing and SEO is fundamentally a CAC argument: the marginal cost of acquiring the 1,000th customer through organic search is far lower than the marginal cost of acquiring the 1,000th customer through paid advertising. Over time, businesses with strong organic presence dramatically outperform paid-dependent competitors on unit economics.
Calculate your channel-specific ROAS (Return on Ad Spend) alongside CAC using our ROAS Calculator to identify which channels are delivering the strongest acquisition efficiency.
💸
LTV Calculator
Pair your CAC with Customer Lifetime Value to confirm your unit economics are sustainable. A healthy LTV:CAC ratio of 3:1 is the benchmark.
The fastest way to lower CAC without reducing marketing spend is to convert more of the prospects already in your funnel. If you are paying $5 per click and converting 2% of visitors to customers, your click-based CAC is $250. If you improve conversion to 4%, your CAC drops to $125 — without changing your ad spend at all.
Test landing page headlines, CTA button copy, social proof elements, form length, and checkout flow. Use our Conversion Rate Calculator to quantify the impact of conversion improvements on CAC before and after changes.
2. Invest in Content Marketing and SEO
Paid advertising delivers immediate results but requires constant spending. The moment you pause Google Ads, the leads stop. Content marketing and SEO build a compounding asset: each article, guide, or resource that ranks on search engines continues generating qualified traffic and leads for months or years after publication, at near-zero marginal cost.
The CAC from organic search for established content-driven businesses is typically 5–10× lower than their paid channel CAC. Building this asset takes 12–24 months of consistent investment, but the long-term economics are transformational.
3. Build a Referral Programme
Referred customers are the lowest-CAC customers in almost every business. They arrive pre-qualified (a friend vouched for you), convert at higher rates, churn less, and have higher LTV. The cost of the referral incentive — typically a discount, account credit, or small cash reward — is almost always far below the cost of the equivalent paid acquisition.
Dropbox's referral programme is the canonical case study: offering free storage to referrers drove 3,900% growth in 15 months, with a referral CAC a fraction of their paid acquisition cost. Design a referral mechanism appropriate for your product and make it easy to share.
4. Improve Lead Quality at the Top of the Funnel
Lowering CAC is not only about reducing cost — it is also about improving the conversion rate from lead to customer. If your sales team is spending significant time on leads that never convert, the cost of those wasted sales cycles inflates your fully loaded CAC dramatically.
Improve lead quality by tightening your targeting (geographic, firmographic, or demographic filters), implementing lead scoring in your CRM, pre-qualifying with intake forms or chatbots, and aligning your content marketing to attract the specific buyer profile that converts at the highest rate.
5. Leverage Marketing Automation
Many CAC-inflating activities — lead nurturing, follow-up sequences, onboarding emails, re-engagement campaigns — can be automated without sacrificing effectiveness. Marketing automation allows your team to operate at much higher capacity, reducing the salary cost per customer acquired without increasing headcount.
Implement automated nurture sequences for leads that are not ready to buy, re-engagement flows for churned or dormant leads, and trigger-based campaigns that respond to specific user behaviours. Each automation that replaces a manual activity lowers the denominator of your per-head cost calculation.
6. Shorten Sales Cycles (B2B)
In B2B businesses, a large portion of fully loaded CAC is attributable to salesperson time — and long sales cycles mean each rep closes fewer deals per quarter. Strategies that compress the time from first contact to closed deal directly reduce the salary cost per customer acquired:
Better sales enablement materials (case studies, ROI calculators, competitive battlecards)
Self-serve pricing and trial options that reduce the need for discovery calls
Shortened proposal and procurement processes (digital signing, faster legal review)
Stronger social proof and reference customers to accelerate trust-building
Each day saved in the average sales cycle reduces CAC by (daily sales cost ÷ average deals per cycle).
Tracking CAC Over Time
CAC is most useful as a trend metric, not a single data point. Calculating it once tells you where you are. Tracking it monthly or quarterly tells you whether you are becoming more or less efficient at acquiring customers — and which changes in your marketing mix or operations are responsible.
The key signals to watch for:
Rising CAC with flat new customer volume — your marketing efficiency is deteriorating. Common causes: increased competition in paid channels driving up CPCs, audience saturation, or marketing spend growing faster than conversion rates.
Rising CAC with rising new customer volume — may be acceptable if your LTV is also growing, or if you are investing in higher-value customer segments. But investigate to confirm the unit economics still work.
Falling CAC with flat or rising volume — the ideal scenario. Efficiency improvements are working, or organic channels are scaling. Reinvest savings in further growth.
High CAC with very long payback but strong LTV — may be sustainable if you have sufficient capital to fund the gap. Evaluate against your cash runway, not just your ultimate profitability.
Frequently Asked Questions
What is a good CAC?
There is no universal good CAC — it is entirely dependent on what each customer is worth to your business (LTV). The only definitive benchmark is that CAC should be significantly lower than LTV, with a ratio of at least 3:1 considered the minimum for a sustainable business model.
Why is my CAC increasing over time?
CAC typically rises as a business scales because the easiest-to-reach, highest-converting prospects are acquired first. As you move to less-qualified audiences, conversion rates fall and cost per acquisition rises. Other common causes include increased competition bidding up paid channel costs, marketing teams growing faster than the revenue they generate, and declining product-market fit in the channels you are using.
Should I calculate CAC by channel?
Yes — blended CAC across all channels is useful for overall business health tracking, but channel-level CAC is essential for budget allocation decisions. Understanding that your SEO-driven CAC is $120 while your paid social CAC is $680 enables you to make dramatically better decisions about where to invest your next marketing pound.
How is CAC different from CPA?
Cost Per Acquisition (CPA) is typically narrower than CAC: it measures the cost of a specific conversion action — a free trial signup, a form submission, a download — rather than the cost of acquiring a paying customer. CPA is a channel-level advertising metric; CAC is a business-level profitability metric. A low CPA does not guarantee a low CAC if the conversion rate from that action to paying customer is poor.
How do I reduce CAC without reducing marketing spend?
The primary levers are: improving conversion rates at each stage of the funnel (more customers from the same traffic), improving lead quality (higher conversion rate from lead to customer), investing in referral programmes (very low marginal cost per acquired customer), and building organic content assets (compounding low-cost acquisition at scale). All of these improve the denominator (new customers) without increasing the numerator (spend).
What happens if my LTV is lower than my CAC?
Your business is losing money on every new customer it acquires. The implications depend on whether this is structural or temporary. For early-stage businesses during an aggressive growth phase (investing ahead of revenue), it may be intentional and temporary. For established businesses, LTV below CAC is a fundamental business model problem that requires either reducing CAC, increasing prices, improving retention to extend customer lifetime, or some combination of all three.
Start Tracking CAC Today
Customer Acquisition Cost is the metric that connects your marketing investment to your business's financial sustainability. Without tracking it, you are flying blind — spending money without knowing whether each pound of marketing spend is generating a positive return over the customer's lifetime.
Use our CAC Calculator to calculate your fully loaded CAC across all channels and periods. Pair it with:
LTV Calculator — to calculate your LTV:CAC ratio and confirm your unit economics are sustainable
ROAS Calculator — to evaluate the return on individual advertising channels
The most efficient growth happens when you understand not just how many customers you are acquiring, but exactly what each one costs — and whether the business you are building will still be standing when the bills come due.
🎯
CAC Calculator
Calculate your fully loaded Customer Acquisition Cost, track it across periods, and confirm your unit economics are built to scale.
CAC is the total cost of sales and marketing efforts that are needed to acquire a new customer over a specific period.
How do you calculate CAC?
Divide the total sales and marketing expenses (including salaries, software, and ad spend) by the number of new customers acquired during that same period.
What is a good LTV to CAC ratio?
A widely accepted benchmark for a healthy business is an LTV:CAC ratio of 3:1, meaning a customer's lifetime value is three times what it cost to acquire them.
What happens if my CAC is higher than my LTV?
If CAC exceeds LTV, your business is losing money on every new customer it acquires. You must immediately reduce marketing costs or find ways to increase customer retention and order value.
Does CAC include employee salaries?
Yes, a true 'fully loaded' CAC calculation must include the salaries of your marketing and sales teams, as well as the cost of the software tools they use.