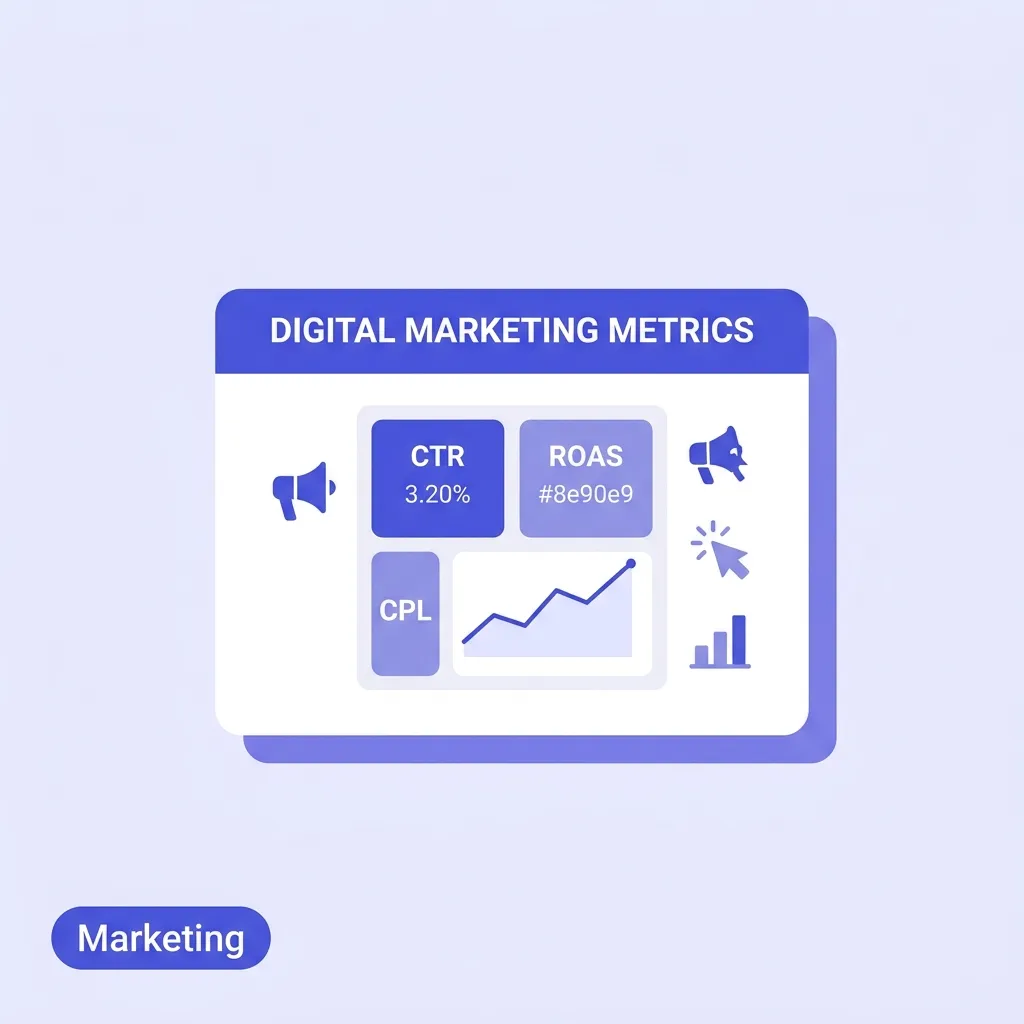
5 Digital Marketing Metrics Every Founder Should Track
Stop wasting budget on vanity marketing metrics. Learn the definitive formulas, benchmarks, and tactical applications for ROAS, LTV, CAC, Conversion Rate, and Churn.
BT
Bizcalc Team
·February 28, 2025
If you ask ten different founders how their marketing is performing, eight of them will answer with a vanity metric. They will tell you about their website traffic, their Instagram follower growth, their email open rates, or the millions of impressions their latest ad campaign received.
These metrics feel good. They trend up reliably. But they are completely disconnected from the financial reality of the business. You cannot pay payroll with impressions, and a high click-through rate does not guarantee a profitable venture.
The most successful founders treat digital marketing not as an art project, but as an engine: fuel (capital) goes in, and mechanical output (profitable revenue) comes out. To manage that engine, you only need to look at five fundamental gauges.
These five digital marketing metrics — Return on Ad Spend (ROAS), Customer Lifetime Value (LTV), Customer Acquisition Cost (CAC), Conversion Rate, and Churn Rate — form a complete, interlocking system for tracking marketing performance. When calculated correctly and viewed together, they tell you exactly where your business is bleeding cash, where you possess a competitive advantage, and exactly which lever to pull next to accelerate growth.
Table of Contents
1. Return on Ad Spend (ROAS)
If you are paying for traffic — whether on Google, Meta, LinkedIn, or programmatic display — Return on Ad Spend is the primary daily health metric for your campaign. It measures the gross revenue generated for every dollar or pound spent on an advertising platform.
ROAS Formula:
ROAS = Total Revenue Generated by Ads ÷ Total Ad Spend
ROAS is frequently expressed as a ratio (e.g., 4:1) or a multiple (e.g., 4x). A 4x ROAS means that for every $1 you put into the ad platform, the platform returned $4 in attributed revenue.
ROAS vs. Marketing ROI
It is crucial not to confuse ROAS with Return on Investment (ROI). ROAS measures the gross efficiency of an advertising channel. It does not account for the cost of the goods sold, agency fees, creative production costs, or software overhead.
A campaign with a 3x ROAS looks successful in the ad manager dashboard, but if your product has a 20% gross margin, that campaign is actually losing money on a net ROI basis. ROAS is the tactical lever you use to optimise within a specific channel; ROI is the strategic metric you use to evaluate overall business profitability.
Calculating Your Break-Even ROAS
To use ROAS effectively, you must first calculate your break-even ROAS — the minimum multiple required so you do not lose money after accounting for your product costs.
Break-Even ROAS = 1 ÷ Gross Profit Margin
If you sell a physical product with a 40% margin: 1 ÷ 0.40 = 2.5x.
Any ROAS below 2.5x means your ads are returning less gross profit than they cost to run. You are paying for the privilege of making a sale.
How to Improve ROAS
Improve targeting: Funnel ad spend away from broad audiences and toward lookalike audiences based on your highest-LTV existing customers.
Implement negative keywords: In search advertising, ruthlessly prune search terms that generate clicks but no conversions.
Enhance ad creative: A higher click-through rate (CTR) signals relevance to ad algorithms, which generally rewards you with a lower Cost Per Click (CPC), thereby lifting ROAS.
Raise your prices/AOV: This is often the fastest way to fix a broken ROAS. If your ad costs stay the same but average order value increases, ROAS automatically improves.
📊
ROAS Calculator
Enter your ad spend and the revenue it generated to instantly see your Return on Ad Spend ratio and compare it against your break-even ROAS target.
If ROAS measures the efficiency of acquiring a single transaction, Customer Lifetime Value (LTV) measures the total economic value of acquiring a customer. It estimates the total gross profit you expect to generate from a customer over the entire duration of their relationship with your business.
LTV is the most important strategic metric a founder can track because it determines your absolute ceiling for acquisition costs. The business with the highest LTV in a market can mathematically afford to spend the most to acquire a customer, driving competitors out of the bidding landscape.
LTV Formula (Subscription/SaaS model):
LTV = Average Monthly Lifetime Revenue per User ÷ Revenue Churn Rate
LTV Formula (eCommerce/Repeat Purchase model):
LTV = Average Order Value × Number of Purchasing Transactions per Year × Average Retention Time in Years
Note: For absolute precision in strategic planning, these revenue figures should be multiplied by your Gross Margin percentage, yielding a true Profit LTV.
Why Founders Get LTV Wrong
Many founders use "Historic LTV" — simply tracking what a customer has spent to date. This is inherently backwards-looking and punishes newly acquired cohorts.
The better approach is "Predictive LTV." This models expected future purchasing behaviour based on historical retention curves and typical buying cadences. Relying purely on historic LTV often leads founders to under-invest in acquisition because they only see the first few months of customer value.
How to Improve Customer LTV
Implement cross-selling and up-selling: Introduce related products or premium tiers at strategic points in the customer lifecycle to raise the average revenue per user (ARPU).
Institute subscription models: Convert single-purchase transactional relationships into recurring revenue streams (e.g., "subscribe and save" in eCommerce).
Optimise the onboarding experience: The majority of customer churn happens in the first 30 days. Teaching customers how to extract maximum value from your product early dramatically extends their lifespan.
Create loyalty programmes: Reward repeat purchasing to increase purchase frequency.
💎
Customer Lifetime Value (LTV) Calculator
Plug in your average order value, purchase frequency, and retention period to calculate the true long-term value of each customer you acquire.
Customer Acquisition Cost (CAC) is the total financial burden required to win one new paying customer. It is the yin to LTV’s yang.
CAC Formula:
CAC = Total Sales and Marketing Expenses ÷ Number of New Customers Acquired
Fully Loaded CAC vs. Advertising CAC
This is where the math goes wrong for many early-stage businesses. Most dashboards report "Ad CPA" (Cost Per Acquisition) — tracking only the actual ad spend divided by the conversions.
Fully Loaded CAC must include everything:
All paid advertising spend
Salaries for the entire marketing and sales team (including employer taxes/benefits)
Overhead attributed to the marketing and sales function
If you only track Ad CPA, your acquisition costs will look unsustainably good, leading to aggressive growth targets that ultimately burn through your cash runway because you ignored the massive fixed infrastructure costs required to support that growth.
The Golden Ratio: LTV:CAC
Neither LTV nor CAC means much in isolation. Their ratio is the ultimate measure of your marketing engine’s sustainability.
LTV:CAC Ratio = Customer Lifetime Value ÷ Customer Acquisition Cost
< 1:1: You are losing money on every customer acquired. The business model is fundamentally broken.
1:1 to 2:1: Survival mode. You are acquiring customers, but there is virtually no margin left to cover operational overhead or generate profit.
3:1: The benchmark consensus for a healthy, sustainable business. Every $1 spent on acquisition generates $3 in long-term value.
> 5:1: You are likely under-investing in marketing. While profitable, you are leaving market share on the table by not spending aggresively enough on acquisition channels.
How to Reduce CAC
Leverage referral marketing: Incentivise your most loyal customers to bring in new ones. Referred leads historically convert significantly higher and cost vastly less than paid acquisition.
Invest in organic SEO and content: Content marketing requires high upfront investment but has near-zero marginal cost per subsequent lead, steadily dragging down your blended CAC over a 12–24 month horizon.
Improve lead qualification: In B2B sales, a massive driver of high CAC is high-salaried sales reps spending time on unqualified leads. Tightening qualification criteria reduces wasted sales cycles.
Conversion Rate measures the percentage of users who take a desired action. It acts as a multiplier across your entire marketing funnel. A minor improvement here mathematically amplifies the return on every single marketing dollar you have already spent.
Conversion Rate Formula:
Conversion Rate = (Total Conversions ÷ Total Visitors/Interactions) × 100
The Concept of Micro vs. Macro Conversions
Founders often stare obsessively at their ultimate "Macro Conversion" rate: Website Visitor → Paying Customer.
However, a funnel is entirely composed of "Micro Conversions."
Ad Impression → Ad Click (Click-Through Rate)
Landing Page Visitor → Email Subscriber
Email Subscriber → Product Page View
Product Page View → Add to Cart
Add to Cart → Completed Sale
If your macro conversion rate is underperforming, you cannot fix it directly. You must map out the micro conversions, identify exactly where the drop-off is occurring (the weakest link), and focus all optimization efforts entirely on that specific transition.
The Mathematics of Conversion Rate Optimization (CRO)
Consider an eCommerce store receiving 50,000 visitors per month:
At a 1.5% conversion rate and a $100 Average Order Value (AOV), it generates $75,000/month.
By optimizing the checkout flow and raising the conversion rate from 1.5% to just 2.0%, revenue jumps to $100,000/month.
That is a 33% increase in top-line revenue generated without spending an additional penny on customer acquisition. This is why CRO is the highest-leverage activity in digital marketing.
How to Improve Conversion Rates
A/B test systematically: Test headlines, hero images, and Call-to-Action (CTA) button copy. Never guess what converts; follow the data.
Reduce friction: Eliminate unnecessary form fields. Implement one-click integrations for sign-ups (e.g., Google/Apple login) or payments (Apple Pay/PayPal).
Deploy social proof: Feature customer testimonials, trust badges, and user-generated content prominently near the point of purchase.
Improve page speed: A site that takes longer than 3 seconds to load suffers massive bounce rates before the conversion process can even begin.
Churn Rate is the percentage of customers who stop using your product or service during a given period. It is the silent killer of growth. If your marketing is a bucket being furiously filled with water, churn is the hole in the bottom. No amount of customer acquisition can outrun a severe churn problem.
Churn Rate Formula:
Churn Rate = (Customers Lost During Period ÷ Total Customers at Start of Period) × 100
There are two primary ways to measure it:
Customer Churn: The percentage of absolute headcounts lost (critical for measuring product-market fit).
Revenue Churn: The percentage of recurring revenue lost (critical for financial forecasting, as losing one enterprise client hurts more than losing five entry-level clients).
The Math of the Leaky Bucket
A high churn rate mathematically mandates an impossibly steep acquisition curve just to tread water.
If you have 1,000 customers and a 5% monthly churn rate, you lose 50 customers a month.
If you acquire 60 new customers per month, your net growth is only 10 customers.
You are spending 100% of your acquisition budget to achieve a net growth rate of just 1%.
Worse, churn compounds. A 5% monthly churn rate equates to losing roughly 46% of your customer base over a 12-month period.
Voluntary vs. Involuntary Churn
To fix churn, you must split it by root cause:
Involuntary Churn occurs when a customer wants to stay but fails due to operational friction — usually expired credit cards, declined payments, or failed banking authentications. This is highly solvable using automated dunning management software and expired card notification workflows.
Voluntary Churn occurs when a customer explicitly cancels. This is a product, pricing, or support issue. The customer ceased finding continuous value in the offering.
How to Reduce Churn
Conduct Exit Surveys: Force an exit survey on user cancellation. You cannot fix voluntary churn if you do not know why it is happening.
Identify Pre-Churn Behaviours: Define the usage metrics that signal a user is losing interest (e.g., zero logins in a 14-day window). Trigger automated customer success outreach or specifically targeted re-engagement email campaigns when these thresholds are breached.
Solve in Onboarding: Most long-term churn is a symptom of poor initial onboarding. If a user never reached their "Aha!" moment of value within their first 7 days, they are mathematically highly likely to churn by day 60.
Determine exactly how much revenue is leaking from your business today with our Churn Rate Calculator.
Building a Marketing OS
Vanity metrics tell a story about popularity. The five metrics outlined above tell the truth about profitability.
By ruthlessly tracking ROAS, LTV, CAC, Conversion Rate, and Churn, you stop guessing whether marketing is working. You start operating your growth strategy like a math equation—where every variable is monitored, measured, and systematically improved to drive sustainable, profitable scale.
📉
Churn Rate Calculator
Find out exactly how much revenue is leaking from your business each month and see how reducing churn by just 1% compounds into significant long-term growth.
What are the most important digital marketing metrics?
Key metrics include Customer Acquisition Cost (CAC), Return on Ad Spend (ROAS), Conversion Rate, Customer Lifetime Value (LTV), and Cost Per Click (CPC).
How do you track digital marketing ROI?
You track ROI by calculating the total revenue generated by a campaign minus the total cost of the campaign, divided by the total cost. UTM parameters and conversion tracking tools are essential for accurate measurement.
What is a good conversion rate?
A 'good' conversion rate depends heavily on your industry and traffic source. Generally, an e-commerce conversion rate between 2% and 3% is considered average, while B2B lead generation often aims for 5% or higher.
What is the difference between CPC and CPA?
Cost Per Click (CPC) is the amount you pay when someone clicks your ad. Cost Per Acquisition (CPA) is the total cost required to generate a complete sale or qualified lead.
Why is Customer Lifetime Value (LTV) important in marketing?
LTV helps you understand how much you can afford to spend to acquire a customer. If your LTV is high, you can safely spend more on marketing (higher CAC) while still remaining profitable.