Break-Even Analysis: A Complete Guide for Small Businesses
Learn how to calculate your break-even point, understand contribution margins, and use break-even analysis to make smarter pricing and growth decisions.
BT
Bizcalc Team
·March 10, 2025
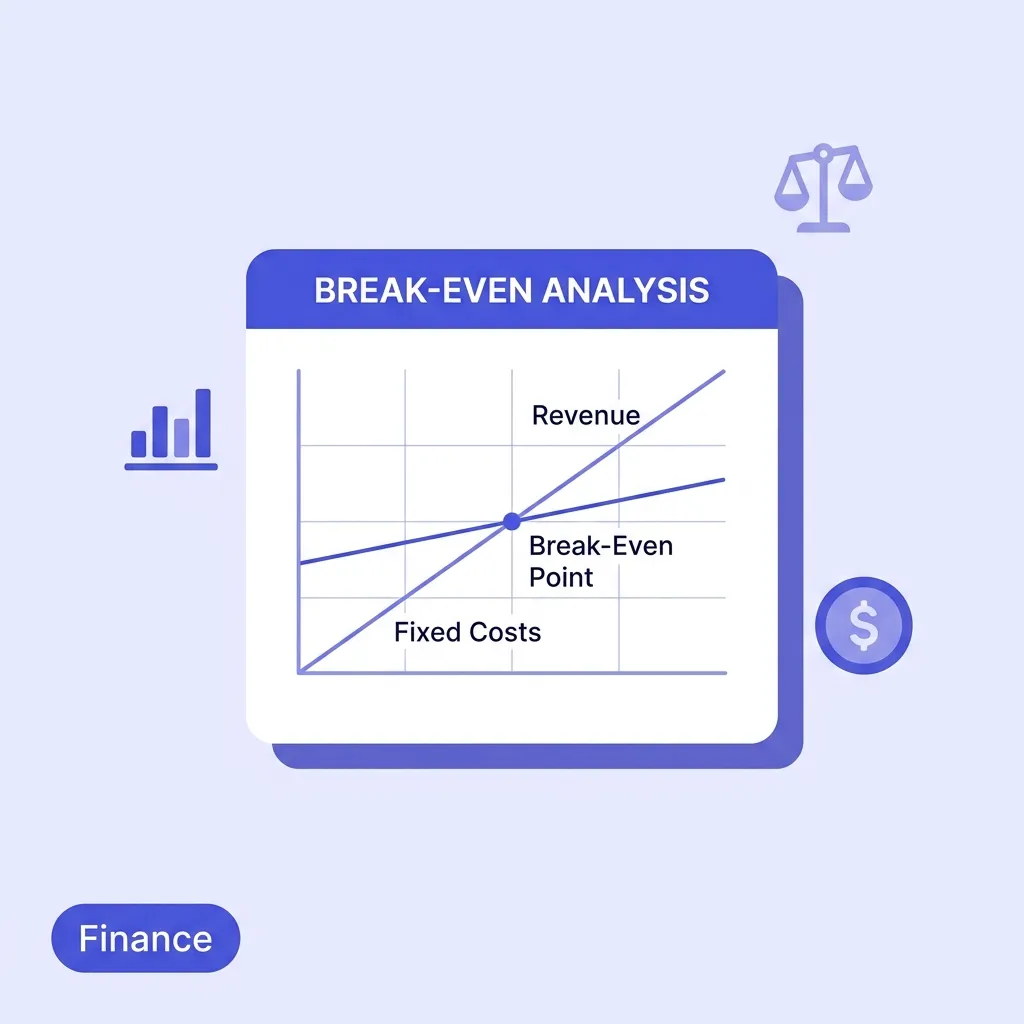
Every business has a break-even point. It is the level of sales at which total revenue exactly equals total costs — where you have covered every expense but have not yet made a single dollar of profit. Below it, every transaction is widening a loss. Above it, every sale is adding directly to your bottom line.
For small business owners, calculating the break-even point is one of the most practically useful financial exercises available. It replaces vague revenue aspirations with a concrete, mathematically grounded sales target. It tells you whether a new pricing decision is genuinely profitable. It gives you the numbers you need to evaluate a business plan, negotiate with investors, or decide whether to launch a new product.
Yet most small business owners either have never run a break-even analysis, or ran one once years ago and have not revisited it since. This guide covers everything: what break-even analysis is, how to calculate it, what contribution margin really means, how to use it for pricing decisions, and the most common mistakes that produce misleading results.
📊
Break-Even Calculator
Plug in your fixed costs, selling price, and variable cost to instantly find your break-even point in units and revenue — no spreadsheet required.
Break-even analysis is a financial calculation that identifies the exact point at which a business's total revenue equals its total costs. At this point, the business is neither making a profit nor incurring a loss — it has "broken even."
The analysis rests on a fundamental distinction between two types of business costs:
Fixed costs are expenses that remain constant regardless of how much you produce or sell. Rent, salaries, insurance premiums, software subscriptions, loan repayments, and equipment depreciation are all fixed costs. Whether you sell ten units or ten thousand, these costs stay the same each month.
Variable costs are expenses that change directly in proportion to your output or sales volume. Raw materials, packaging, shipping fees, payment processing commissions, and direct labour for production are variable costs. The more you sell, the higher your total variable costs.
This distinction is the engine of break-even analysis. Fixed costs create the hurdle you must clear. Variable costs determine how efficiently each sale helps you clear it.
The Break-Even Formula Explained
The standard break-even formula calculates the number of units you need to sell to cover all your costs:
Break-Even Units = Fixed Costs ÷ (Selling Price per Unit − Variable Cost per Unit)
The component in the denominator — selling price minus variable cost per unit — is called the contribution margin. This is the amount each sale "contributes" toward covering your fixed costs before any profit is generated.
You can also express break-even as a revenue figure rather than a unit count:
Break-Even Revenue = Fixed Costs ÷ Contribution Margin Ratio
Where: Contribution Margin Ratio = Contribution Margin per Unit ÷ Selling Price per Unit
This revenue-based formula is particularly useful for service businesses where "units" are difficult to define — consultants billing for hours, agencies billing for retainers, or SaaS companies with variable subscription tiers.
Break-Even Analysis Example: Product Business
Let us walk through a concrete example. Suppose you run a small candle manufacturing business:
Break-even point = $5,000 ÷ $17 = 295 candles per month
Break-even revenue = 295 × $25 = $7,353 per month
This means you need to sell 295 candles every month simply to pay your bills. Candle number 296 is where profitability begins — and every candle after that adds $17 directly to your profit.
Break-Even Analysis Example: Service Business
Now consider a freelance graphic designer:
Monthly fixed costs: $2,200 (home office proportion, accounting software, Adobe CC, professional insurance, bank fees)
Average project rate: $800 per project
Variable costs per project: $50 (subcontracted elements, file delivery, client communication tools)
Contribution margin = $800 − $50 = $750 per project
Break-even point = $2,200 ÷ $750 = 2.93 projects per month (round up to 3)
Break-even revenue = 3 × $800 = $2,400 per month
For this designer, closing 3 projects a month is the minimum viable workload. Everything from project 4 onwards — at $750 net contribution each — is building the business's profitability.
Understanding Contribution Margin
Contribution margin is one of the most important and under-understood metrics in small business finance. It deserves more than a passing mention in a formula explanation.
Contribution Margin per Unit
This is the raw pound or dollar amount each sale contributes toward fixed costs and profit after its own variable costs are covered. In our candle example, $17 per candle. This number tells you:
How quickly each sale helps you reach break-even
How sensitive your profitability is to volume changes
Whether a proposed discount still leaves enough contribution to be worthwhile
Contribution Margin Ratio (CMR)
The contribution margin ratio expresses the contribution margin as a percentage of the selling price:
This means 68 pence of every pound of revenue goes toward covering fixed costs and generating profit. The remaining 32 pence covers the variable cost of producing the candle.
A high CMR is generally desirable — it means more of each sale flows toward profit once fixed costs are covered. Software businesses often have CMRs of 70–85% because their variable cost per additional user is near zero. Retail businesses typically run 30–50%. Manufacturing 20–40%. Knowing your CMR helps you benchmark your business model and understand how scalable your business genuinely is.
Contribution Margin vs Gross Profit Margin
These are related but distinct metrics that are frequently confused:
Contribution Margin
Gross Profit Margin
Purpose
Break-even and volume decisions
Overall profitability reporting
What it includes
Only variable costs
Cost of goods sold (may include fixed overhead)
Best used for
Pricing, sales targets, product mix
P&L reporting, investor reporting
For break-even analysis, always use contribution margin (variable costs only) — not gross margin, which may include allocated fixed costs that distort the calculation.
Why Break-Even Analysis Is Essential for Small Business Decision-Making
The break-even point is not just a number to calculate once and file away. It is a living benchmark that should inform several of the most consequential decisions you make in your business.
Setting Realistic Sales Targets
Many small businesses set revenue goals based on aspiration rather than calculation. "We want to hit $200,000 this year" is common. What break-even analysis gives you instead is: "We need to sell at least X units per month just to cover costs, and Y units per month to hit our target profit." This transforms a vague goal into an operational minimum.
Evaluating Pricing Decisions
Pricing is where break-even analysis delivers its most immediate value. Every pricing decision changes your contribution margin per unit, which then changes how many units you need to break even.
Consider the candle example with three pricing scenarios:
Selling Price
Variable Cost
Contribution Margin
Break-Even Units
$22
$8
$14
357 units
$25
$8
$17
295 units
$30
$8
$22
227 units
A $5 price increase (20%) reduces the break-even point by 68 units (23%). Conversely, a $3 price reduction (12%) increases the break-even by 62 units (21%). This asymmetry is why small price increases are almost always more powerful than equivalent cost reductions — and why discounting is so dangerous for businesses with thin contribution margins.
💰
Profit Margin Calculator
After you know your break-even, use this to verify your pricing generates healthy margins across your entire product or service range.
Before committing capital to a new product line, second location, or market expansion, run the break-even numbers. The key question is: given the incremental fixed costs this venture adds, how many additional sales are needed to cover them — and is that a realistic volume to achieve?
If opening a second café location would add $8,000 in monthly fixed costs (rent, staff, equipment), and your average contribution margin per customer is $4.50, you would need 1,778 additional customers per month before the second location breaks even. Is your target location's catchment area likely to generate that footfall? If not, the expansion does not pencil out — regardless of how attractive the premises look.
Understanding Your Margin of Safety
The margin of safety is the gap between your current sales volume and your break-even point. It tells you how much your sales can decline before you start losing money.
Margin of Safety (units) = Current Sales − Break-Even Sales
Margin of Safety (%) = (Current Sales − Break-Even Sales) ÷ Current Sales × 100
If you are currently selling 420 candles per month against a break-even of 295, your margin of safety is 125 candles, or 30%. Your sales could fall by 30% before you begin making a loss. A margin of safety above 20–25% is generally considered healthy for a stable small business. Below 10–15% is a warning sign that the business is operating close to its cost floor.
Making Informed Hiring Decisions
Every new employee adds to your fixed cost base, which raises your break-even point. Before hiring, calculate the new break-even with the added salary cost and quantify exactly how many additional sales the hire needs to generate to justify the cost.
If adding a $30,000/year sales person ($2,500/month) raises your break-even by 147 candles per month (at $17 contribution margin), the hire pays for itself if they generate more than 147 additional monthly sales. This becomes the internal target you set for the hire — not an arbitrary performance review metric.
How to Lower Your Break-Even Point
Lowering the break-even point gives your business more resilience, flexibility, and profit potential. There are three levers, and they are not equal in power:
1. Increase Your Selling Price
Raising prices has a multiplicative effect on contribution margin. A 10% price increase on a product with a 70% CMR reduces the break-even point by roughly 12–15%. Price increases also do not introduce operational complexity — there are no new processes, suppliers, or headcount to manage.
The psychological resistance to raising prices is almost always overestimated relative to the actual customer response. For commoditised products sold on price alone, increases can lose customers. For differentiated products, services, or brands with established reputation, price sensitivity is far lower. Use our Markup Calculator to model the effect of price increases on your margins.
2. Reduce Variable Costs
Lower variable costs per unit raise the contribution margin and therefore lower break-even. Strategies include:
Negotiating volume discounts with suppliers
Switching to more cost-effective materials or components without compromising quality
Reducing packaging complexity
Optimising delivery routes and carrier contracts
Automating labour-intensive production steps
Variable cost reductions are valuable but have diminishing returns — you can only reduce material costs so far before quality suffers. They also often require minimum order quantities or capital investment to achieve.
3. Reduce Fixed Costs
Lower fixed costs directly lower the break-even threshold. Every pound of fixed cost you eliminate reduces the number of units needed to break even by (1 ÷ contribution margin per unit). On our $17 CMR candle: saving $500/month in rent reduces break-even by 29 units.
Strategies include:
Renegotiating rent — particularly viable post-pandemic with many commercial landlords preferring flexible terms to vacancy
Switching to remote or hybrid working to reduce office costs
Auditing software subscriptions for tools no longer actively used
Refinancing loans at lower interest rates
Fixed cost reductions are often more tractable than revenue growth but should be pursued carefully — some fixed costs (skilled staff, key software, insurance) are genuine business necessities, not waste.
Break-Even Analysis for Multi-Product Businesses
The formulas above assume a single product or service. Real businesses typically sell multiple products with different prices, variable costs, and contribution margins. In this case, you need a weighted average contribution margin based on your expected or historical sales mix.
Weighted Average CM = Σ (CMR per product × % of total revenue from that product)
For example, if a café sells coffee (CMR 65%, 60% of revenue) and food (CMR 40%, 40% of revenue):
Apply this to total fixed costs to get the total revenue break-even for the whole business. The limitation of this approach is that it assumes your sales mix stays constant — if you run a promotion on lower-margin items and they become a higher share of revenue, your effective break-even rises.
Common Mistakes That Produce Misleading Break-Even Results
Misclassifying Semi-Variable Costs
Some costs are neither purely fixed nor purely variable — they have a fixed component and a usage-based component. Electricity, telephone plans, and some staffing arrangements fall into this category. Treating these as entirely fixed overstates your fixed cost base; treating them as entirely variable understates it. The honest approach is to split them: estimate the fixed floor and the variable rate, and assign each to the correct category.
Using the Wrong Time Horizon
Break-even analysis is typically monthly. Make sure your fixed costs, selling price, and variable cost assumptions all use consistent time periods. If your accountant gives you annual fixed costs, divide by 12 before inserting them into the monthly calculation.
Ignoring Economies of Scale
The variable cost per unit often decreases as volume increases, because suppliers offer volume discounts, labour becomes more efficient, and overhead can be spread across more units. A static break-even analysis does not capture this dynamic. For businesses expecting rapid volume growth, model break-even across multiple volume scenarios rather than relying on a single calculation.
Treating Break-Even as the Goal
Break-even is a floor, not a target. The goal is profitability beyond break-even. Once you know your break-even point, set a target profit level and calculate the additional units or revenue required to achieve it. This is sometimes called the profit target formula:
Units for Target Profit = (Fixed Costs + Target Profit) ÷ Contribution Margin per Unit
If you want $3,000/month net profit from your candle business: ($5,000 + $3,000) ÷ $17 = 471 candles per month. Now you have a real operational target, not just a survival threshold.
Frequently Asked Questions
How often should I recalculate my break-even point?
Recalculate whenever a significant variable changes: when you change your prices, when a major fixed cost changes (a new lease, a hire, a loan), or when supplier costs shift materially. As a minimum cadence, revisit your break-even quarterly as part of your financial review. Many growing businesses find their break-even point changes significantly year to year as their cost structure evolves.
What is a good break-even point?
There is no universal "good" break-even point — it is relative to your market, your sales capacity, and your business model. What matters is whether your break-even volume is achievable given your market size, competitive position, and realistic sales capacity. A break-even that requires capturing 60% of a limited local market is a warning sign; one requiring 5% of an accessible and growing market is a green flag.
Is break-even analysis the same as profit and loss analysis?
No — they are complementary but different tools. A profit and loss (P&L) statement shows what actually happened over a period: revenue earned, costs incurred, and the resulting profit or loss. Break-even analysis is a forward-looking planning tool that calculates what the business needs to achieve to reach profitability. Use both: the P&L to understand the past, break-even to plan the future.
Can break-even analysis be used for a startup with no sales history?
Yes — in fact, break-even analysis is arguably most valuable at the startup stage, when it disciplines the business plan with financial reality before any capital is deployed. Estimate your monthly fixed costs conservatively, research variable costs through supplier quotes and industry benchmarks, and set your initial pricing. The break-even calculation will tell you whether the business model is viable at realistic sales volumes.
How does break-even analysis relate to pricing strategy?
Directly and powerfully. Break-even analysis quantifies exactly how much a price change affects your profitability threshold. Before changing your prices — upward or downward — run the break-even calculation under the new price to see how the required volume changes. This is especially important before offering discounts: a 20% discount on a product with a 40% contribution margin ratio reduces the CMR to 25%, which means you need to sell 60% more units just to break even on the same fixed costs.
Calculate Your Break-Even Point Now
Understanding your break-even point transforms the way you think about every business decision: pricing, hiring, new product development, location expansion, and promotional strategy.
⚖️
Free Break-Even Calculator
Enter your costs and selling price and get your break-even point in units and revenue, your contribution margin, and your margin of safety — all in real time.
The numbers are the start of the conversation — not the end. But you cannot have the conversation without them.
Frequently Asked Questions
What is break-even analysis?
Break-even analysis is a financial calculation that determines the exact sales volume or revenue needed to cover all fixed and variable costs, resulting in a net profit of zero.
Why is the break-even point important?
It tells business owners exactly when they will start making a profit, helping them set sales targets, price products correctly, and evaluate the financial viability of new projects.
What are fixed vs. variable costs?
Fixed costs (like rent and insurance) remain constant regardless of how much you sell. Variable costs (like raw materials and shipping) increase directly with the number of units produced or sold.
How do you lower a break-even point?
You can lower your break-even point by reducing fixed costs, negotiating lower variable costs with suppliers, or increasing the selling price of your product.
Can break-even analysis be used for services?
Yes! For service businesses, the 'unit' is simply an hour of service or a single project. The formula remains the same: Fixed Costs ÷ (Price per Service - Variable Cost per Service).
#break-even#profitability#pricing#cost analysis#small business finance